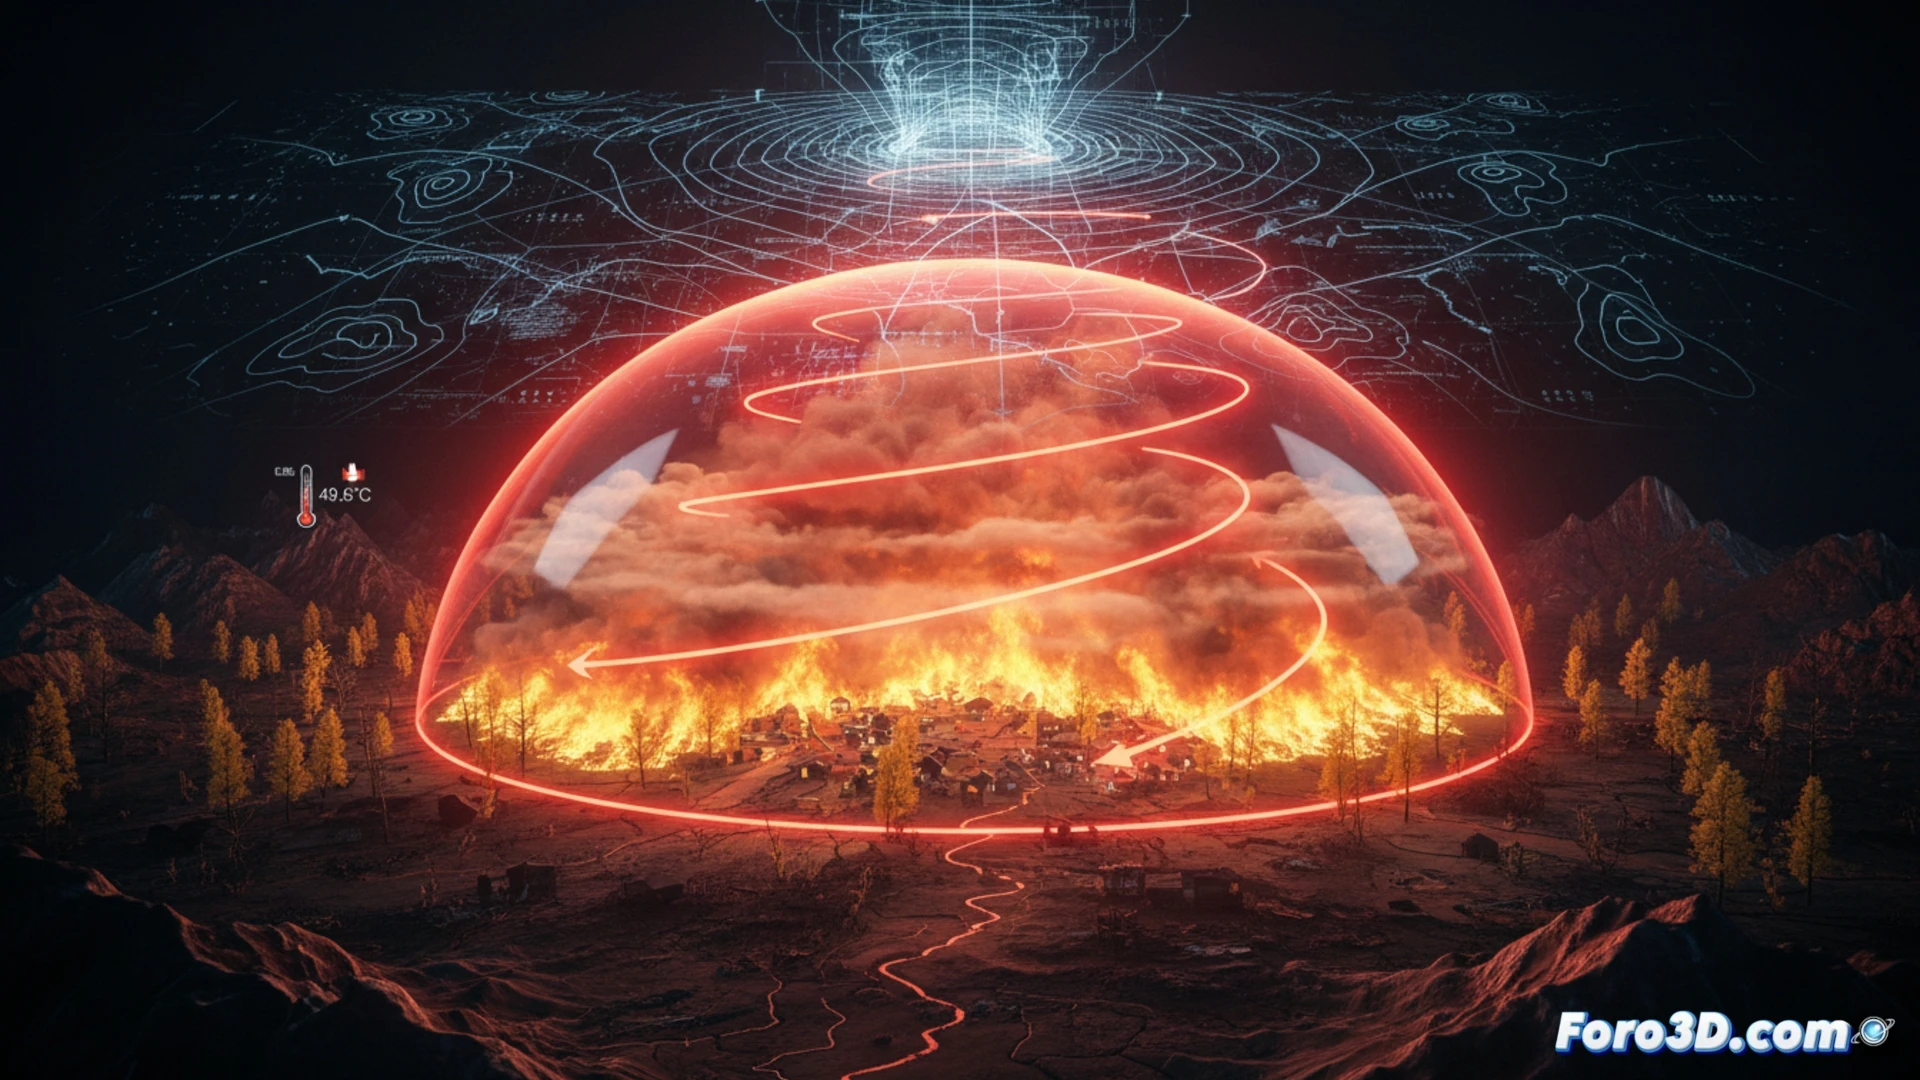
In June 2021, the town of Lytton, British Columbia, recorded 49.6°C, the highest temperature ever documented in Canada. This extreme event, known as a heat dome, acted like an atmospheric pressure cooker, trapping hot air under a high-pressure dome. The combination of extreme heat and dryness triggered spontaneous wildfires that razed 90% of the town, demonstrating the lethality of these phenomena.
Thermal Simulation with WRF and Houdini 🌡️
To understand the mechanics of the disaster, the WRF (Weather Research and Forecasting) model was used to recreate the atmospheric conditions of that week. Pressure, temperature, and wind data were exported to Houdini, where fluid dynamics were applied to visualize the accumulation of thermal energy. The simulation showed how the high-pressure dome compressed the air, preventing convection and generating a positive feedback effect. With ArcGIS 3D, this dynamic was overlaid on the actual terrain of Lytton, identifying the most vulnerable slopes where solar radiation was concentrated, accelerating vegetation ignition.
Lessons for Disaster Prevention 🔥
These simulations allow predicting in advance where a heat dome may generate critical fire points. By integrating meteorological data from WRF with propagation models in Houdini, emergency services can plan selective evacuations and deploy resources in areas of highest thermal risk. Lytton reminds us that climate change intensifies these phenomena; 3D visualization is now an indispensable tool for saving lives in the face of the next atmospheric pressure cooker.
What 3D modeling methodology would you apply to simulate the progression of the Lytton heat dome and visualize its atmospheric pressure cooker effect on the valley's topography and infrastructure?
(PS: Simulating disasters is fun until your computer melts down and you are the disaster.)