Modeling the Subsurface in 3D with Electrical Resistivity Detects Mining Contamination
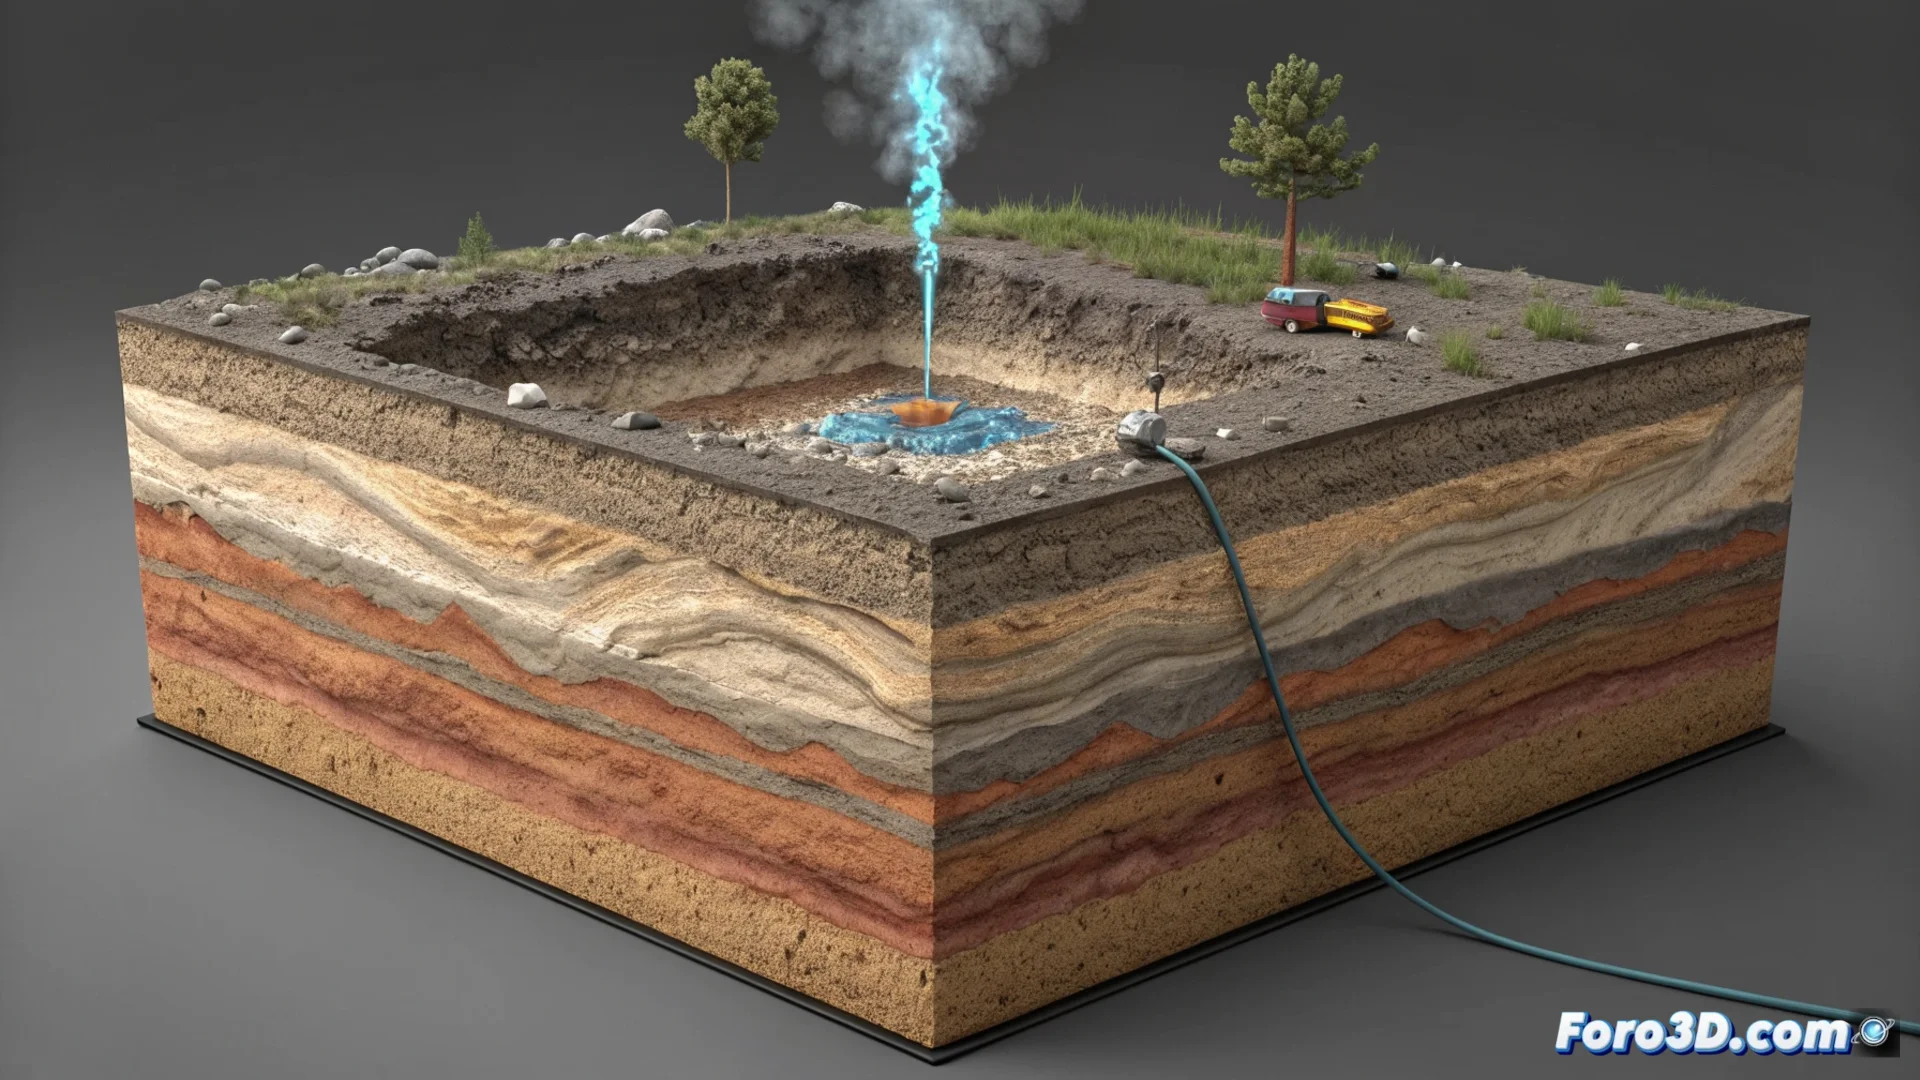
Visualizing what happens beneath our feet is now possible with advanced geophysical techniques. Electrical resistivity tomography builds three-dimensional models of the subsurface by measuring how it resists an injected electric current. Alterations in this property, caused by contaminant fluids, reveal their presence without the need to excavate. 🕵️♂️
The Subsurface Speaks Through Electricity
The key to the method lies in the fact that each material conducts electricity differently. Electrical resistivity varies according to the soil's porosity, how much water it contains, and its chemical composition. Mine leachates, loaded with salts and metals, are excellent conductors. By processing hundreds of measurements from the surface, specialized software generates a 3D volumetric model where these contaminated zones stand out as low-resistivity volumes.
Key advantages of this technology:- It is a non-invasive method that avoids drilling numerous exploratory boreholes.
- It allows mapping the full extent and depth of a contaminant plume.
- It facilitates monitoring over time how contamination migrates and evaluating remediation measures.
A 3D resistivity model integrated with direct data is the technical basis for critical environmental management decisions.
From Raw Data to a Reliable 3D Model
For the model to be accurate, electrical data alone is not enough. The interpretation is calibrated and constrained with direct geological information. Records from drillings and core samples provide real control points on rock types and groundwater depth. This validation is crucial for adjusting the interpretation of detected anomalies.
Steps to integrate the information:- Acquire resistivity profiles on a grid over the study area.
- Process raw data with inversion algorithms to build an initial 3D model.
- Incorporate drilling data to verify and adjust lithological layers in the model.
- Integrate all sources into a single visualization tool for precise analysis.