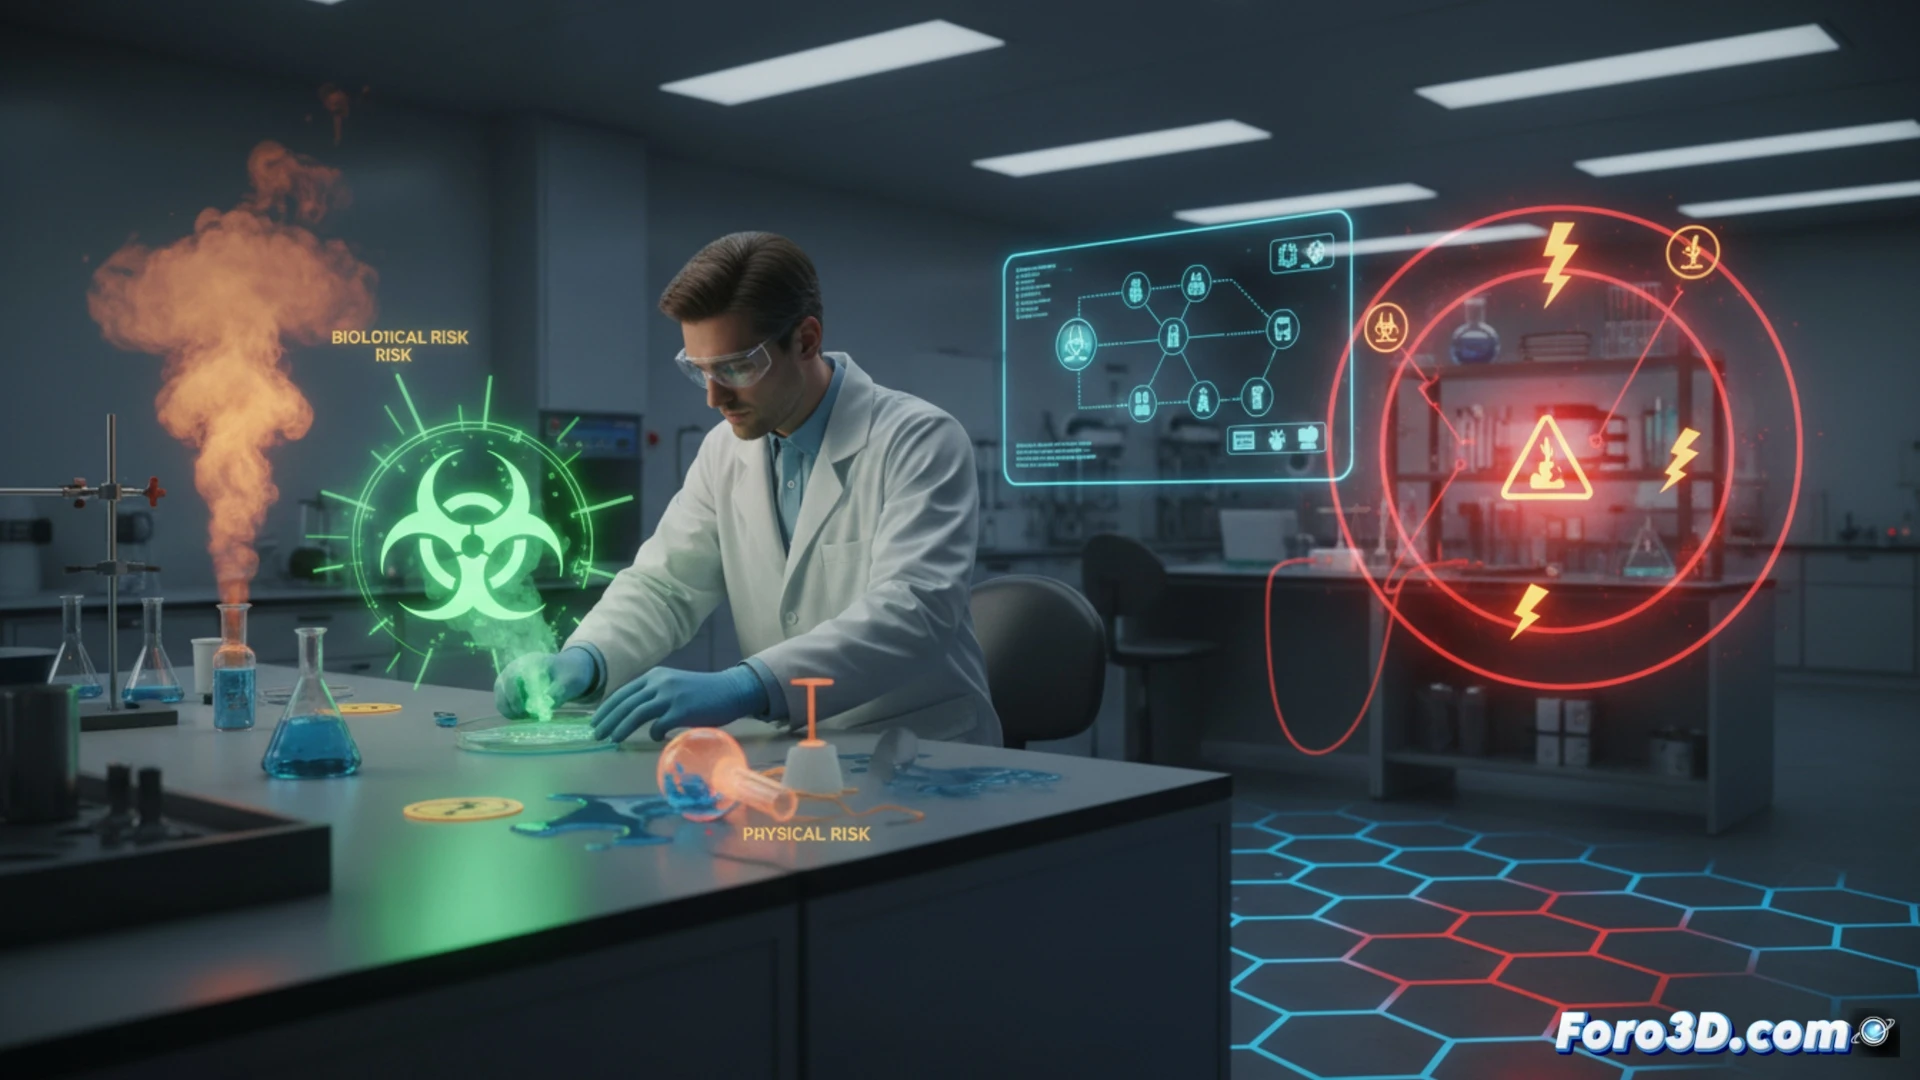
The occupational health of laboratory technicians is a critical field where biological, chemical, and physical hazards converge. From exposure to pathogens in blood samples to eye strain from microscopy, each risk demands detailed analysis. Three-dimensional visualization allows modeling these environments to identify critical points, predict accidents, and design more effective safety protocols, transforming abstract data into interactive prevention maps.
3D Modeling of Exposure Scenarios and Accident Heat Maps 🔥
Using 3D modeling tools, we can recreate a virtual laboratory marked with high-risk zones: areas for handling biological agents (blood, urine, cultures) where the spread of contaminant aerosols is simulated, workstations with glassware prone to punctures and cuts, and sectors with toxic or corrosive chemicals. Heat maps of accident incidence, generated from epidemiological data in the sector, are overlaid on the model to identify hot spots where most incidents occur. Additionally, interactive graphs allow visualizing accumulated eye strain during hours of microscopy and stress levels according to workload, offering a dynamic representation of physical and psychosocial risks.
From Simulation to Prevention: The Value of Visual Epidemiology 🧬
The integration of contaminant spread simulations and safety protocols in 3D infographics not only improves staff training but also allows anticipating fire or explosion scenarios before they occur. This visual epidemiology approach turns accident data into predictive tools, helping to design ergonomic workstations and reduce exposure to biological and chemical risks. Visualizing danger is the first step to mastering it.
What software do you recommend for integrating epidemiological data with 3D models?