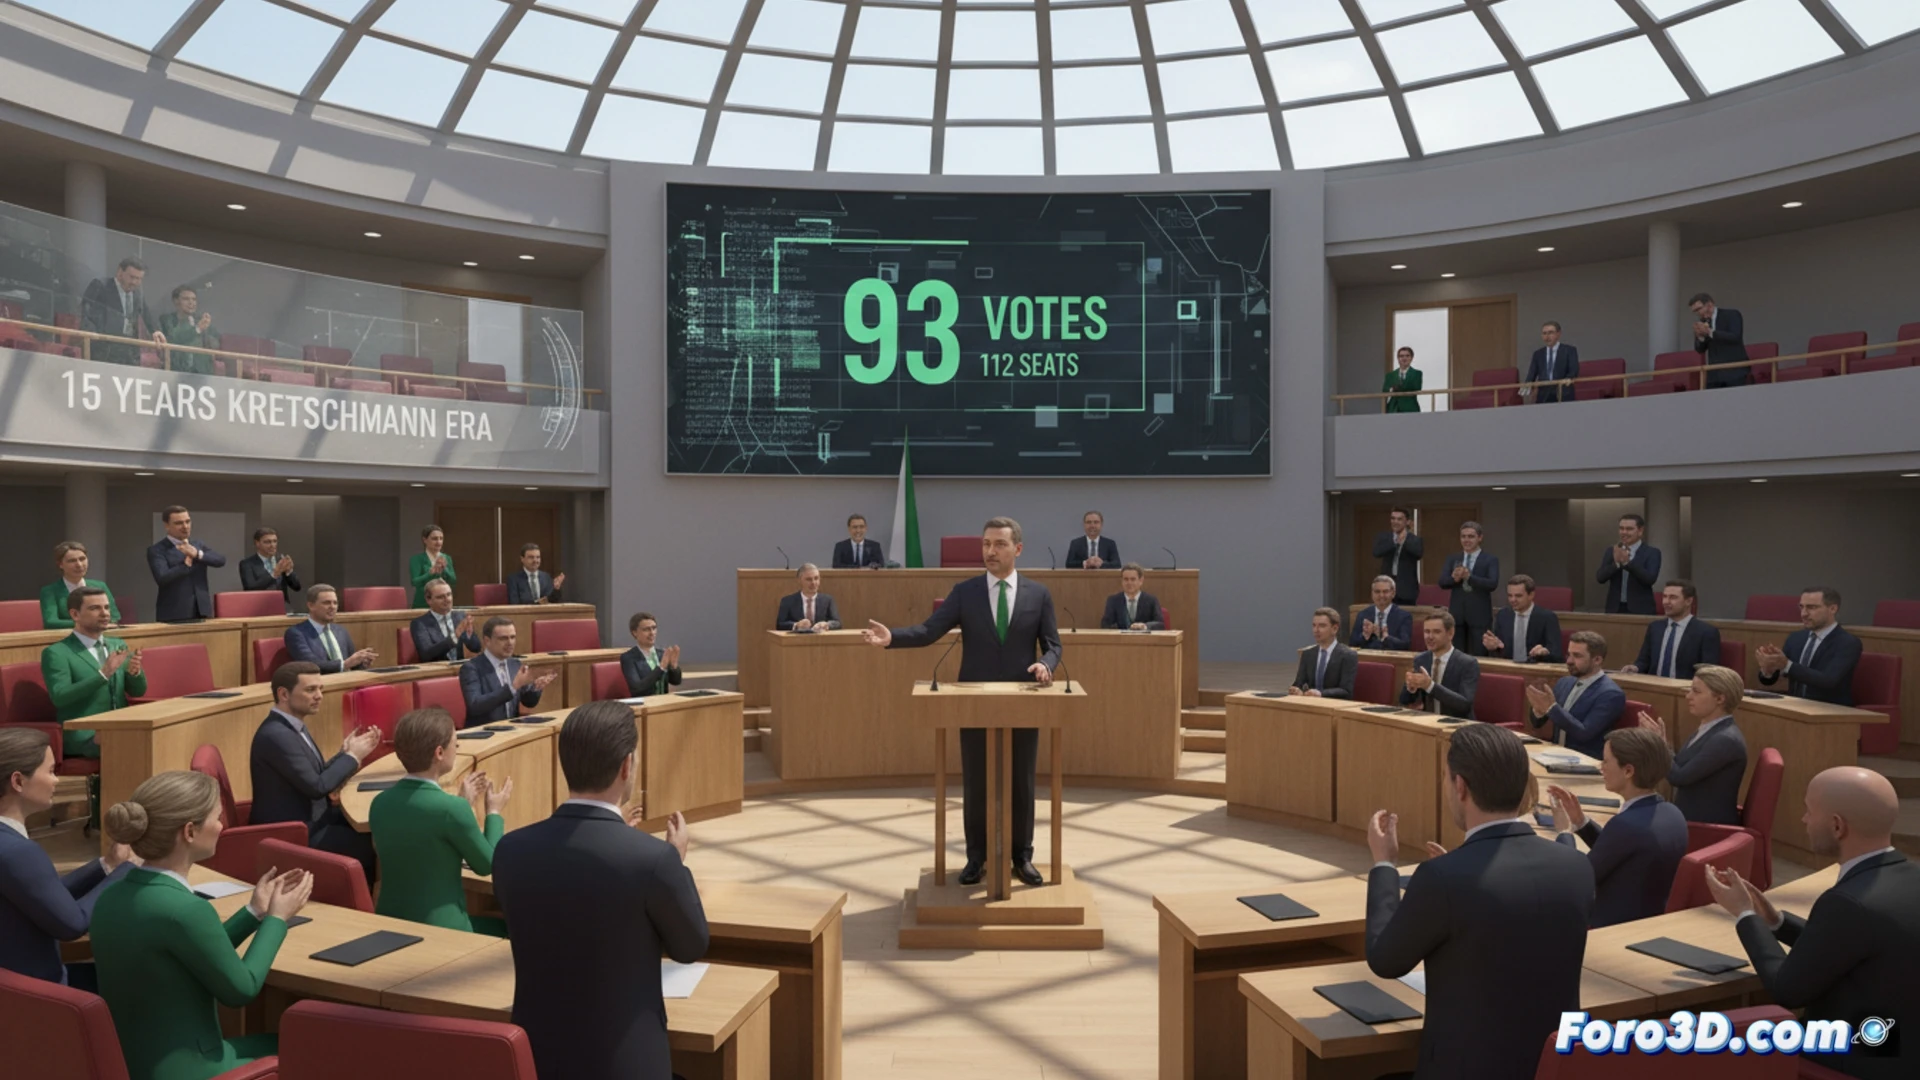
The regional parliament of Stuttgart has confirmed Cem Özdemir as the new Minister-President of Baden-Württemberg, succeeding Winfried Kretschmann after 15 years in office. The vote yielded 93 votes in favor of Özdemir, a figure notably lower than the 112 seats that make up the governing coalition of the Greens and the CDU. This numerical discrepancy reveals internal fissures and raises questions about the solidity of the governmental pact.
Interactive 3D infographic: Seat distribution and coalition simulation 🏛️
To analyze this political scenario, we propose an interactive 3D infographic of the Stuttgart chamber. Each seat is represented as a three-dimensional prism colored according to the party: green for the Greens, black for the CDU, and differentiated shades for the opposition (SPD, FDP, AfD). Clicking on a block displays its affiliation and representative data. The tool will highlight Özdemir's 93 votes in a pulsating tone, while the 19 coalition seats that did not support him will appear dimmed. A three-dimensional timeline will span Kretschmann's 15 years in office, showing legislative milestones. Additionally, a simulation module will allow the user to reconfigure alliances: by dragging virtual seats, alternative majorities can be visualized, such as a possible pact between the Greens and the SPD, calculating the resulting votes in real time.
The power of spatial data for understanding democracy 🧠
This volumetric representation transforms an abstract electoral result into a tangible experience. By physically seeing the distance between the 93 votes obtained and the 112 of the coalition, the user understands the fragility of the new government. 3D visualization not only informs but also invites reflection on political engineering: how is an executive sustained with such tight internal support? what alternative coalitions would be viable? Democratizing access to this data through interactive models fosters a more critical and participatory citizenry.
How can real-time 3D visualization of political data, such as the power transition in Baden-Württemberg, improve transparency and citizen participation in democratic decision-making?
(PS: visualizing a political debate in 3D is easy; the hard part is making sure it doesn't look like a WWE match)