Air pollution represents one of the greatest environmental risks to global health, directly linked to the increase in respiratory and cardiovascular diseases. Until now, 2D maps have shown particle concentrations but lacked the depth to understand how urban topography and winds affect actual dispersion. 3D mapping changes this perspective, offering a volumetric representation that allows epidemiologists and urban planners to visualize toxic plumes in real time.
Integration of sensor data and meteorological models in 3D environments 🌍
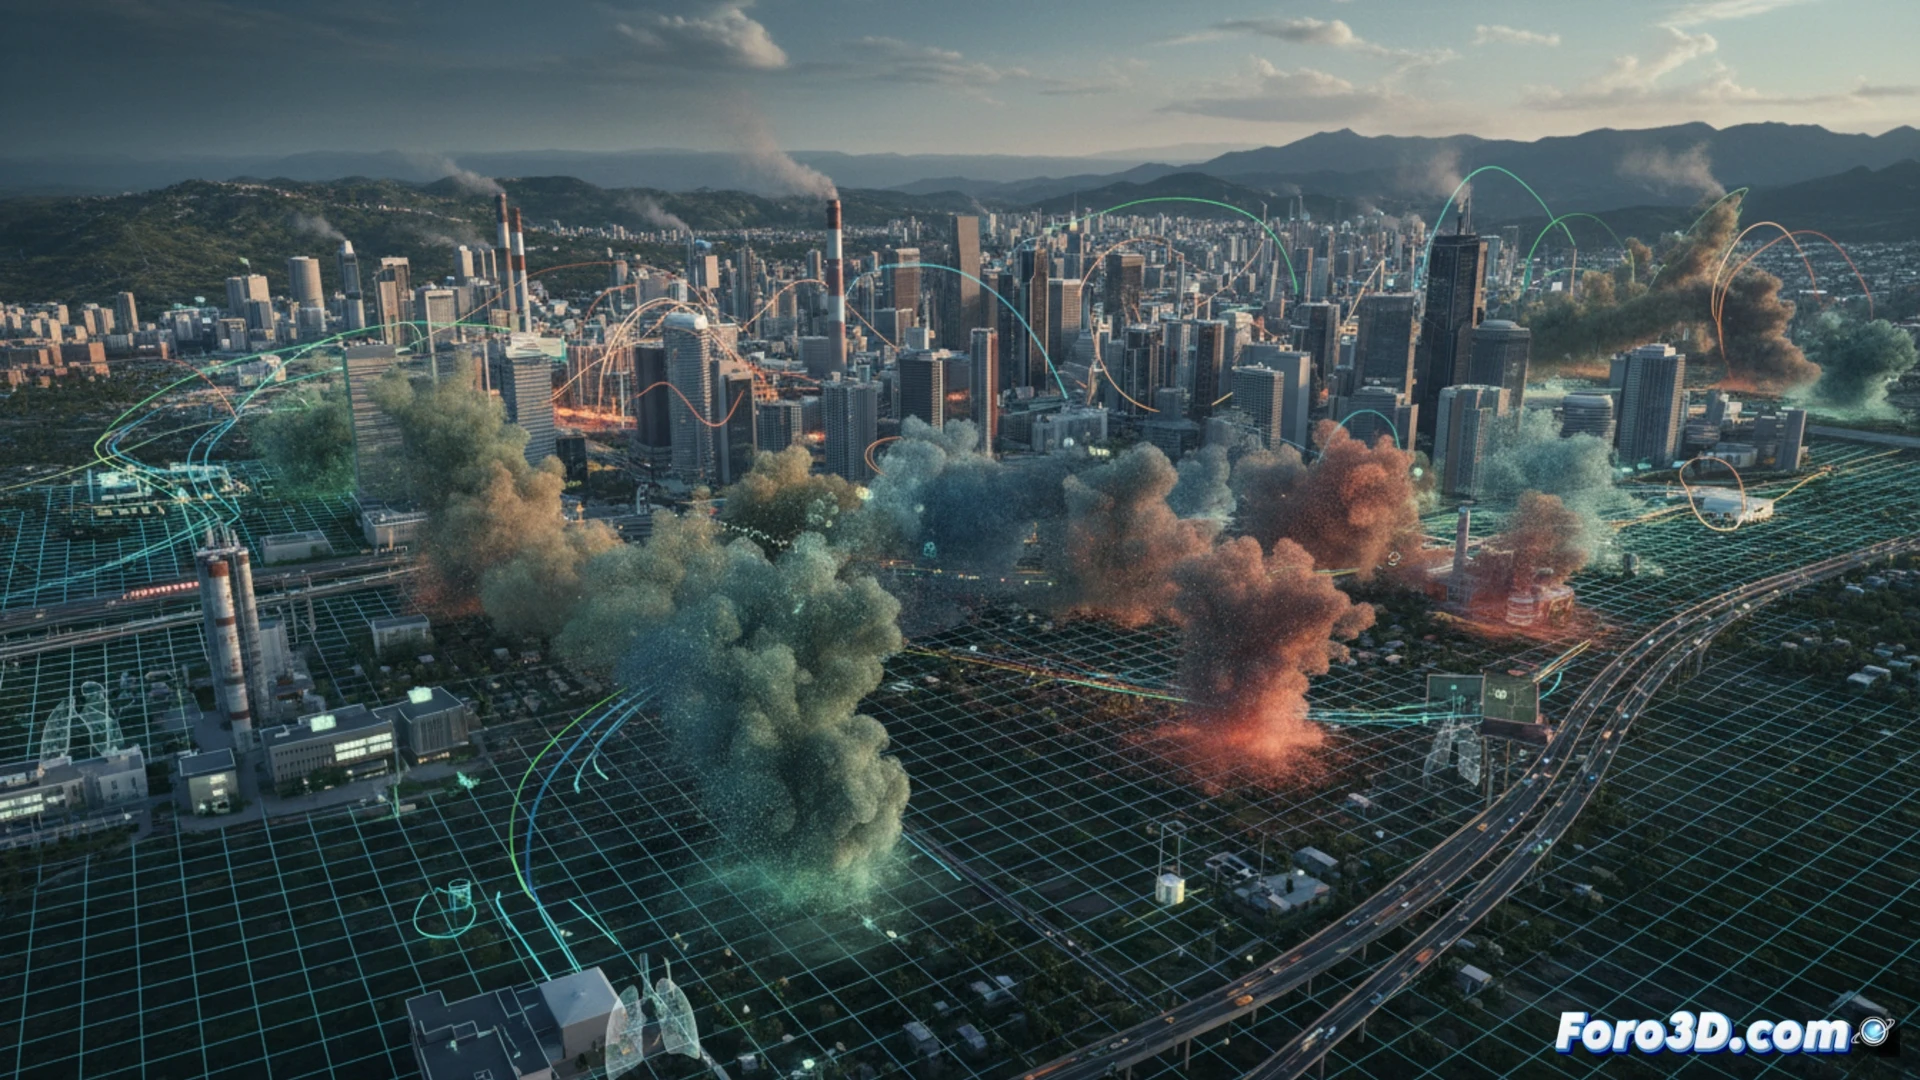
The technical key lies in the fusion of data from ground monitoring stations, satellites, and high-resolution meteorological models. Using visualization software such as Unity or Cesium, a three-dimensional mesh of the city is generated where each node represents a sampling point. Interpolation algorithms, such as Kriging, allow estimating PM2.5 and NO2 concentrations in areas without sensors. The simulation includes variables such as wind speed, temperature, and building height, creating an interactive heat map that shows how particles accumulate in urban canyons or disperse in open areas. This makes it possible to predict the evolution of a toxic plume after an industrial accident or a forest fire.
The silent impact of pollution on health geography 🏥
By overlaying these 3D models with data on the incidence of asthma, COPD, or lung cancer, alarming spatial patterns are revealed. Entire neighborhoods located in topographical depressions or near high-traffic roads show hospitalization rates up to 30% higher. This visualization not only helps identify critical areas but also allows authorities to design more effective mitigation policies, such as relocating schools or creating green corridors. Visual epidemiology, enhanced by 3D, thus becomes a tool for environmental justice and health prevention.
How can real-time 3D visualization of airborne pollutant dispersion improve the prediction of respiratory disease outbreaks in vulnerable populations?
(PS: the 3D incidence maps look so good they almost make being sick enjoyable)