A macro-study published in Nature with nearly 500,000 adults reveals that sleeping between 6 and 8 hours is the cheapest intervention to slow down aging. The researchers built 23 biological clocks that measure the state of 17 organs, and the conclusion is clear: both lack and excess of sleep accelerate cellular deterioration, with the brain being the most vulnerable organ.
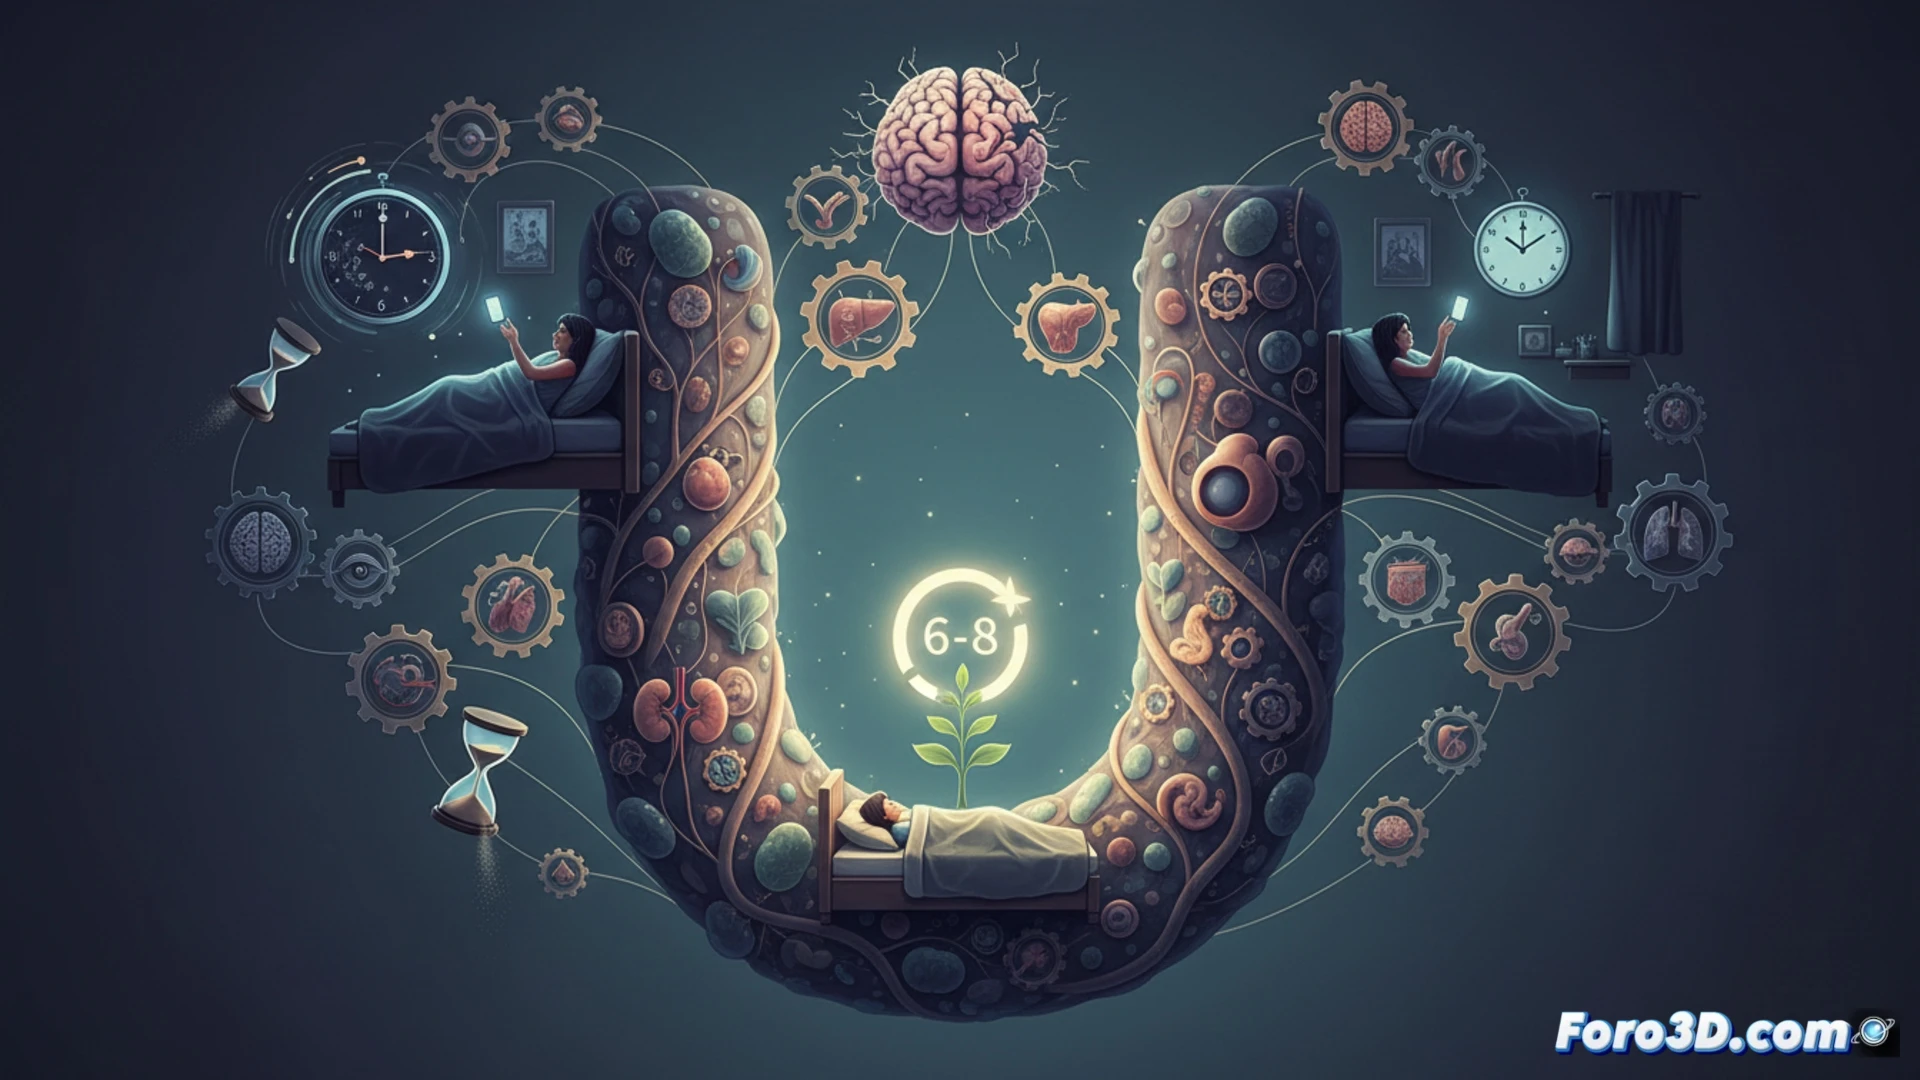
3D Visualization of 17 Organs and the Impact of Deep Sleep 🧠
To represent this data in an interactive 3D infographic, we would model the U-shaped curve of aging versus hours of sleep. The X-axis would show from 4 to 10 hours, and the Y-axis the rate of biological aging. At the lowest point of the U (7 hours), a semi-transparent three-dimensional brain would be placed, which upon rotation would reveal the glymphatic system in operation. Hovering over the ends of the curve, the model would show a deteriorated brain with accumulation of metabolic waste. The remaining 17 organs (heart, liver, kidneys, lungs, etc.) would appear as orbital spheres around the brain, each with a heat map that changes color according to the selected user's age range and gender. An animated timeline would show the accumulated damage after 5, 10, and 20 years of poor sleep habits.
The Paradox of Excess: When Sleeping More Is Not Synonymous with Health ⚠️
The infographic must include a key visual warning: excess sleep (more than 8 hours) also accelerates aging, but researchers point out that this is usually a symptom of underlying diseases, not the cause. By clicking on the right side of the curve, a 3D pop-up would show elevated inflammatory markers in the blood (such as C-reactive protein), accompanied by a comparison between an active glymphatic system (with bright blue cerebrospinal fluid flow) and a deteriorated one (with slow flow and grayish color).
How would you represent in 3D the incidence of obesity by geographic regions?