The barber profession, traditionally linked to aesthetics, hides a complex health risk profile. According to data from the International Labour Organization, workers in this sector show a significant incidence of musculoskeletal disorders (MSDs), contact dermatitis, and sharps injuries. This article proposes a 3D infographic representation to visualize the prevalence of these pathologies, comparing them with other trades and analyzing exposure factors.
Analysis methodology: heat maps and incidence charts 📊
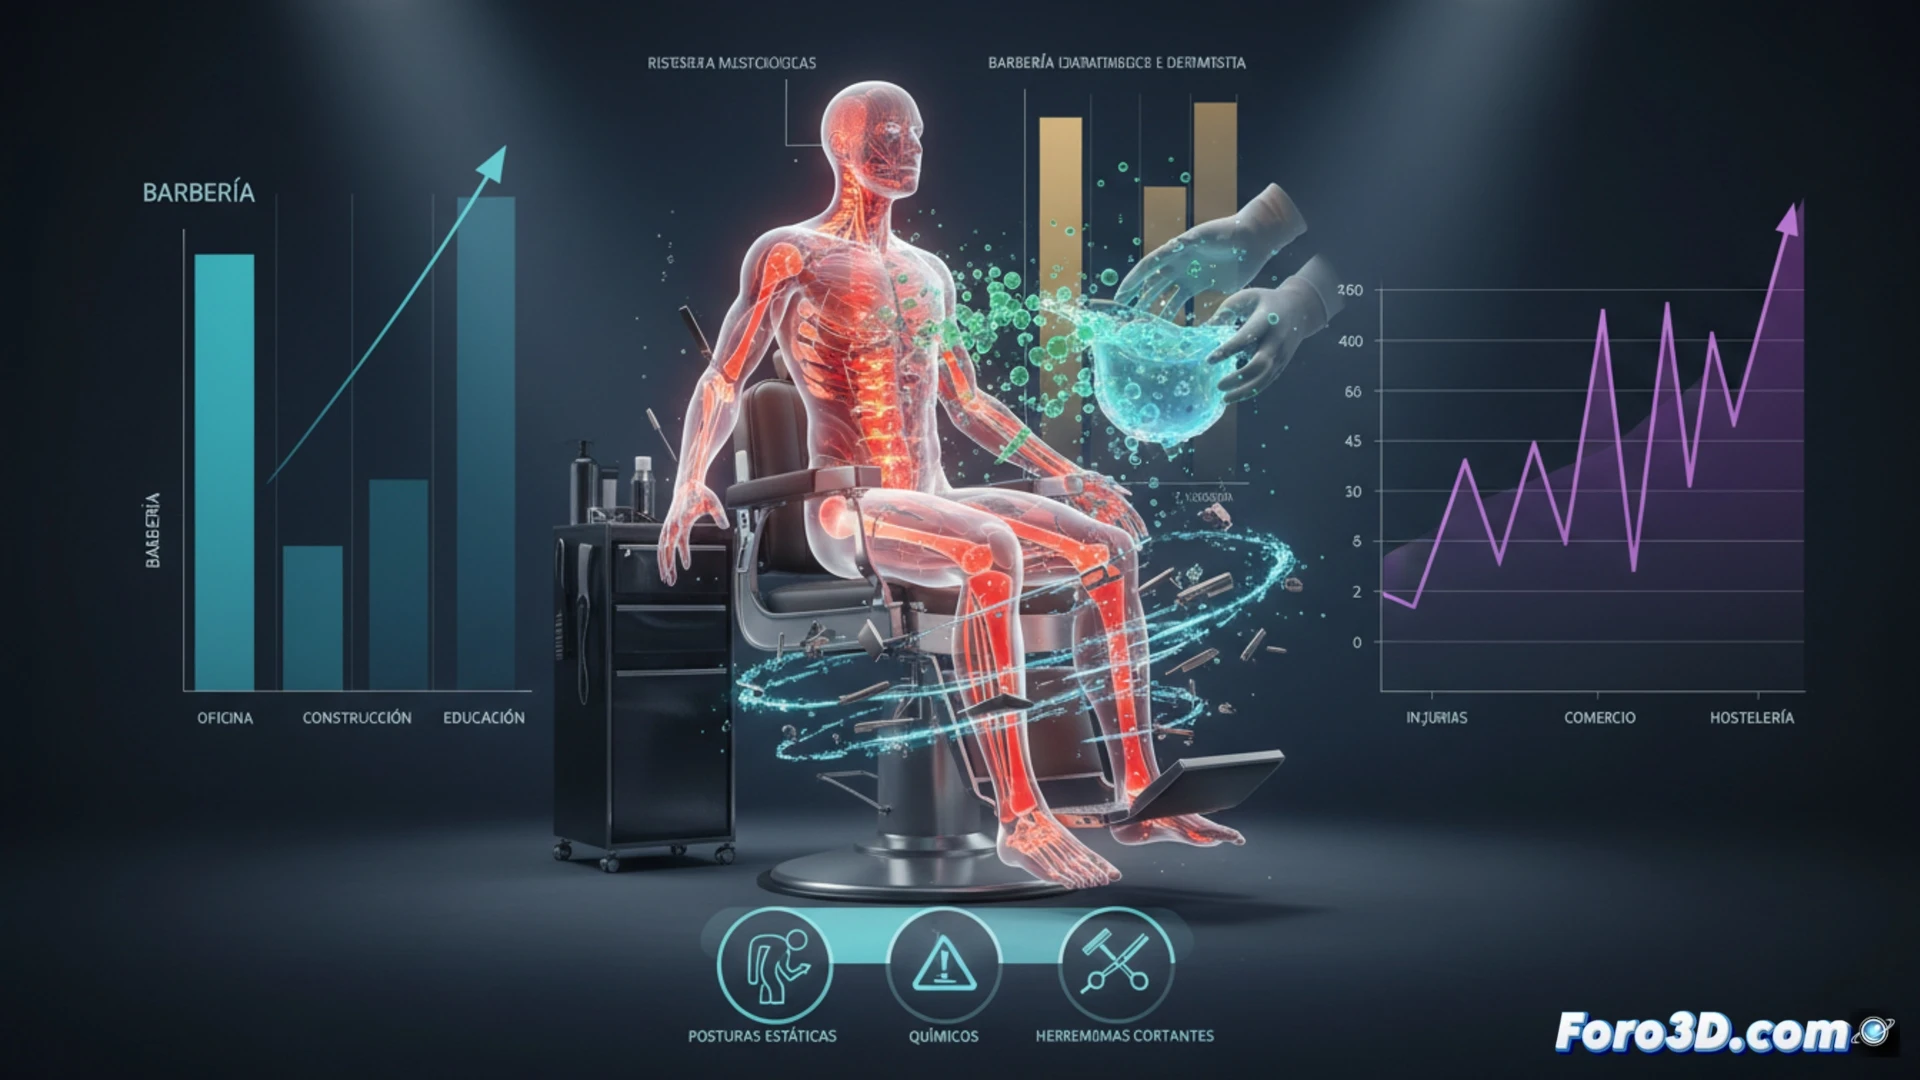
For the infographic, three main variables will be modeled. First, a body heat map will show the concentration of MSDs in barbers: the cervical and lumbar area accumulates 65% of discomfort, due to prolonged static postures (neck flexion greater than 30 degrees). Second, a comparative bar chart will reveal that barbers have 2.3 times the risk of developing allergic dermatitis compared to office workers, mainly due to exposure to fragrances and preservatives in lotions and oils. Third, a flowchart will be included detailing the biological risk route: an accidental cut with a razor can expose the professional to bloodborne pathogens such as HBV, with a reported accident rate of 4.7 per 100 workers per year.
Lessons for the visual health of the trade 🧑🏫
The three-dimensional representation of this data not only facilitates understanding of the problem but also allows for the identification of preventable patterns. For example, the heat map reveals that 78% of barbers with more than 10 years in the trade report chronic pain in the dominant shoulder. This suggests the need to redesign workstations and promote active breaks. The infographic aims to be a didactic tool for unions and prevention services, transforming cold statistics into a visual alert about the health of a group that is often overlooked.
What tools would you use to visualize the temporal evolution of this epidemic?