Aquaculture, a key sector in food production, exposes workers to a lethal combination of hazards. Drowning due to negligence in water systems, exposure to bacteria and parasites, handling of chemicals, and physical exertion under adverse weather conditions create a unique risk profile. This analysis proposes an interactive 3D infographic to model and communicate these dangers, transforming epidemiological data into a visual prevention tool.
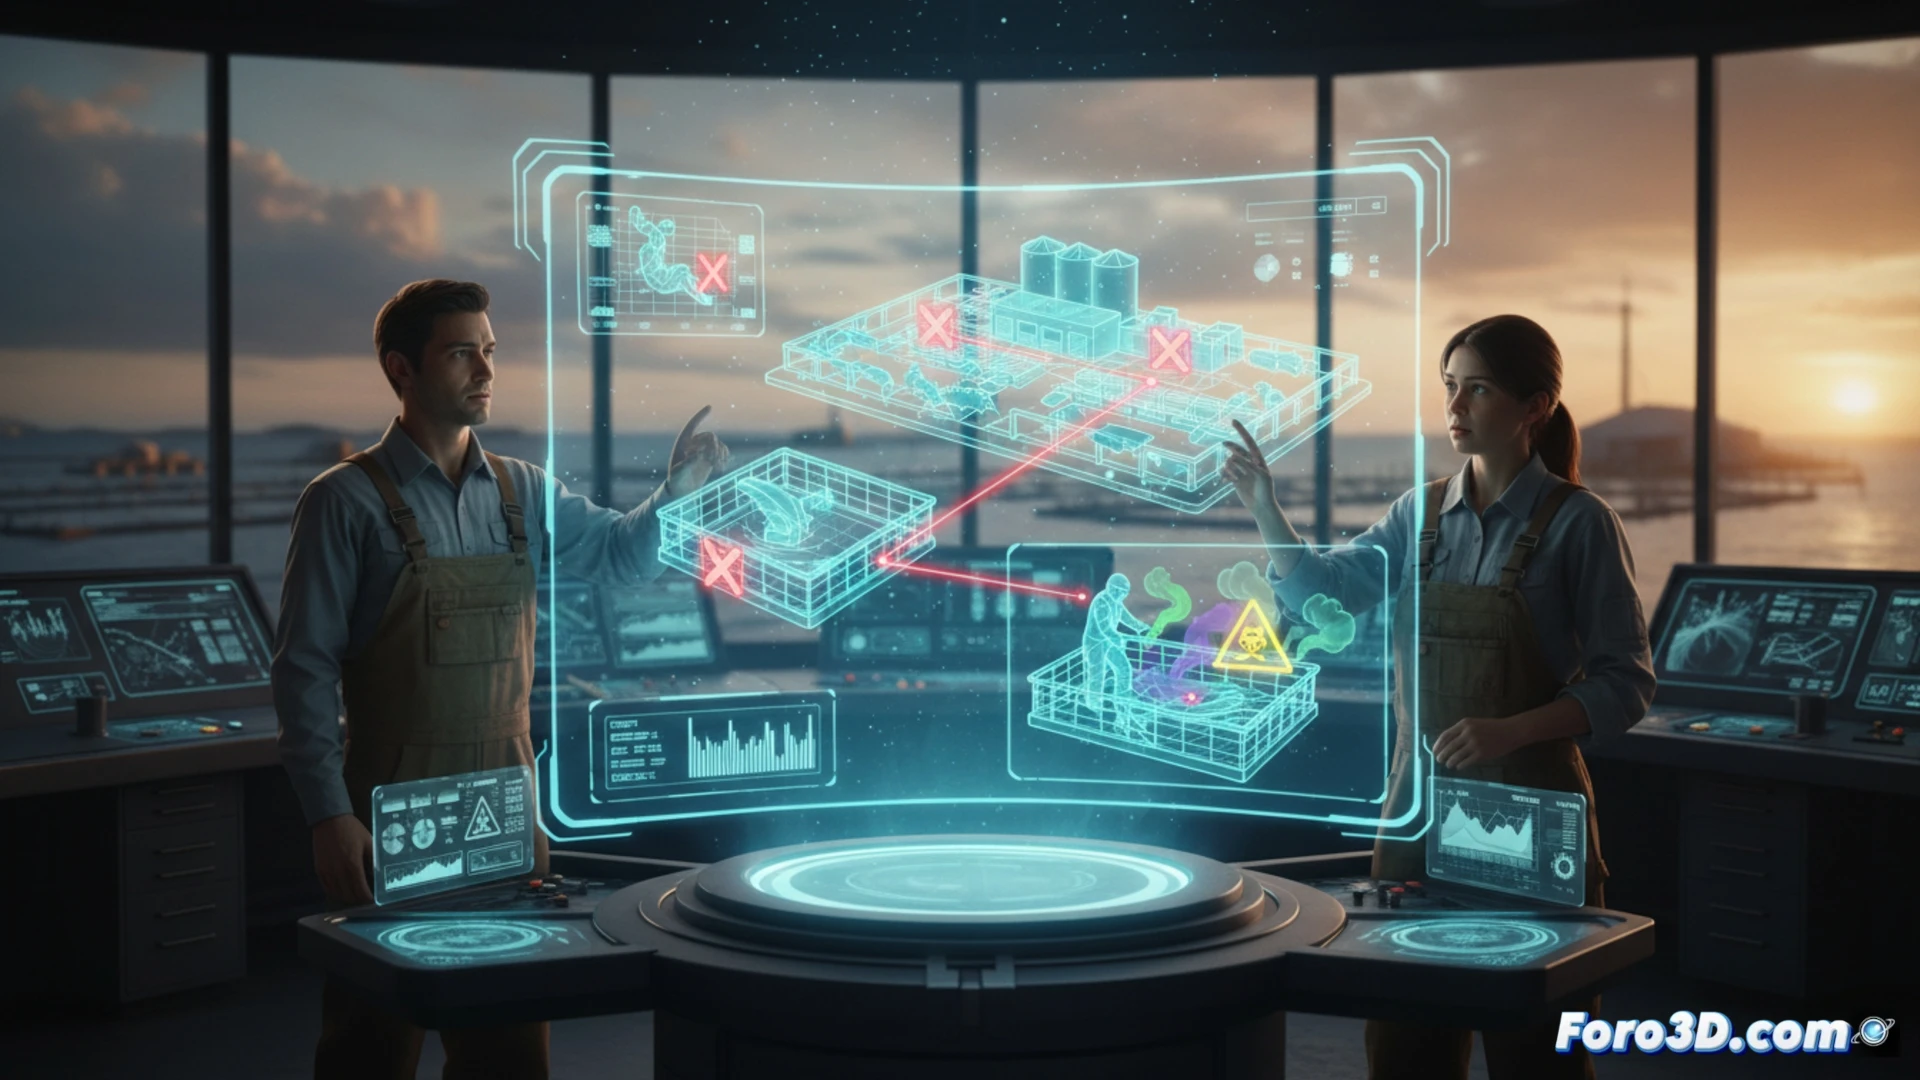
3D Modeling of Pathogens and Exposure Zones 🦠
The infographic will represent water systems with animations of currents and depth, highlighting high-risk areas for drowning. Pathogens such as Vibrio vulnificus and parasites like anisakis will be modeled in 3D, integrating data on the incidence of occupational diseases in the sector. Chemical handling areas will be visualized with semi-transparencies and color codes to indicate toxicity. Physical exertion will be simulated using a body heat map on an animated human model, showing the accumulation of tension in the back and limbs during the loading of nets or cages.
Visual Prevention for an Invisible Sector 🛡️
The statistical invisibility of risks in aquaculture hinders their prevention. By converting workplace accident data into an interactive 3D experience, we not only educate the worker but also force the protocol designer to confront the physical reality of the trade. This tool aims to bridge the gap between abstract epidemiology and daily practice in fish farms, saving lives through the visualization of danger.
How can 3D visualization of drowning risks and other hazards in aquaculture be integrated to design more effective prevention protocols and reduce workplace accidents?
(PS: modeling health data is like going on a diet: you start with energy and end up giving up)