The florist trade, seemingly bucolic, hides a complex epidemiological reality. Cuts from scissors and thorns, dermatitis from fertilizers, allergies to fungi, and falls on wet floors create a risk profile that is often underestimated. From a public health perspective, analyzing these factors allows for the design of visual and effective preventive strategies for a sector with a high incidence of musculoskeletal and dermal injuries.
Risk and injury mapping: from hands to back 🌿
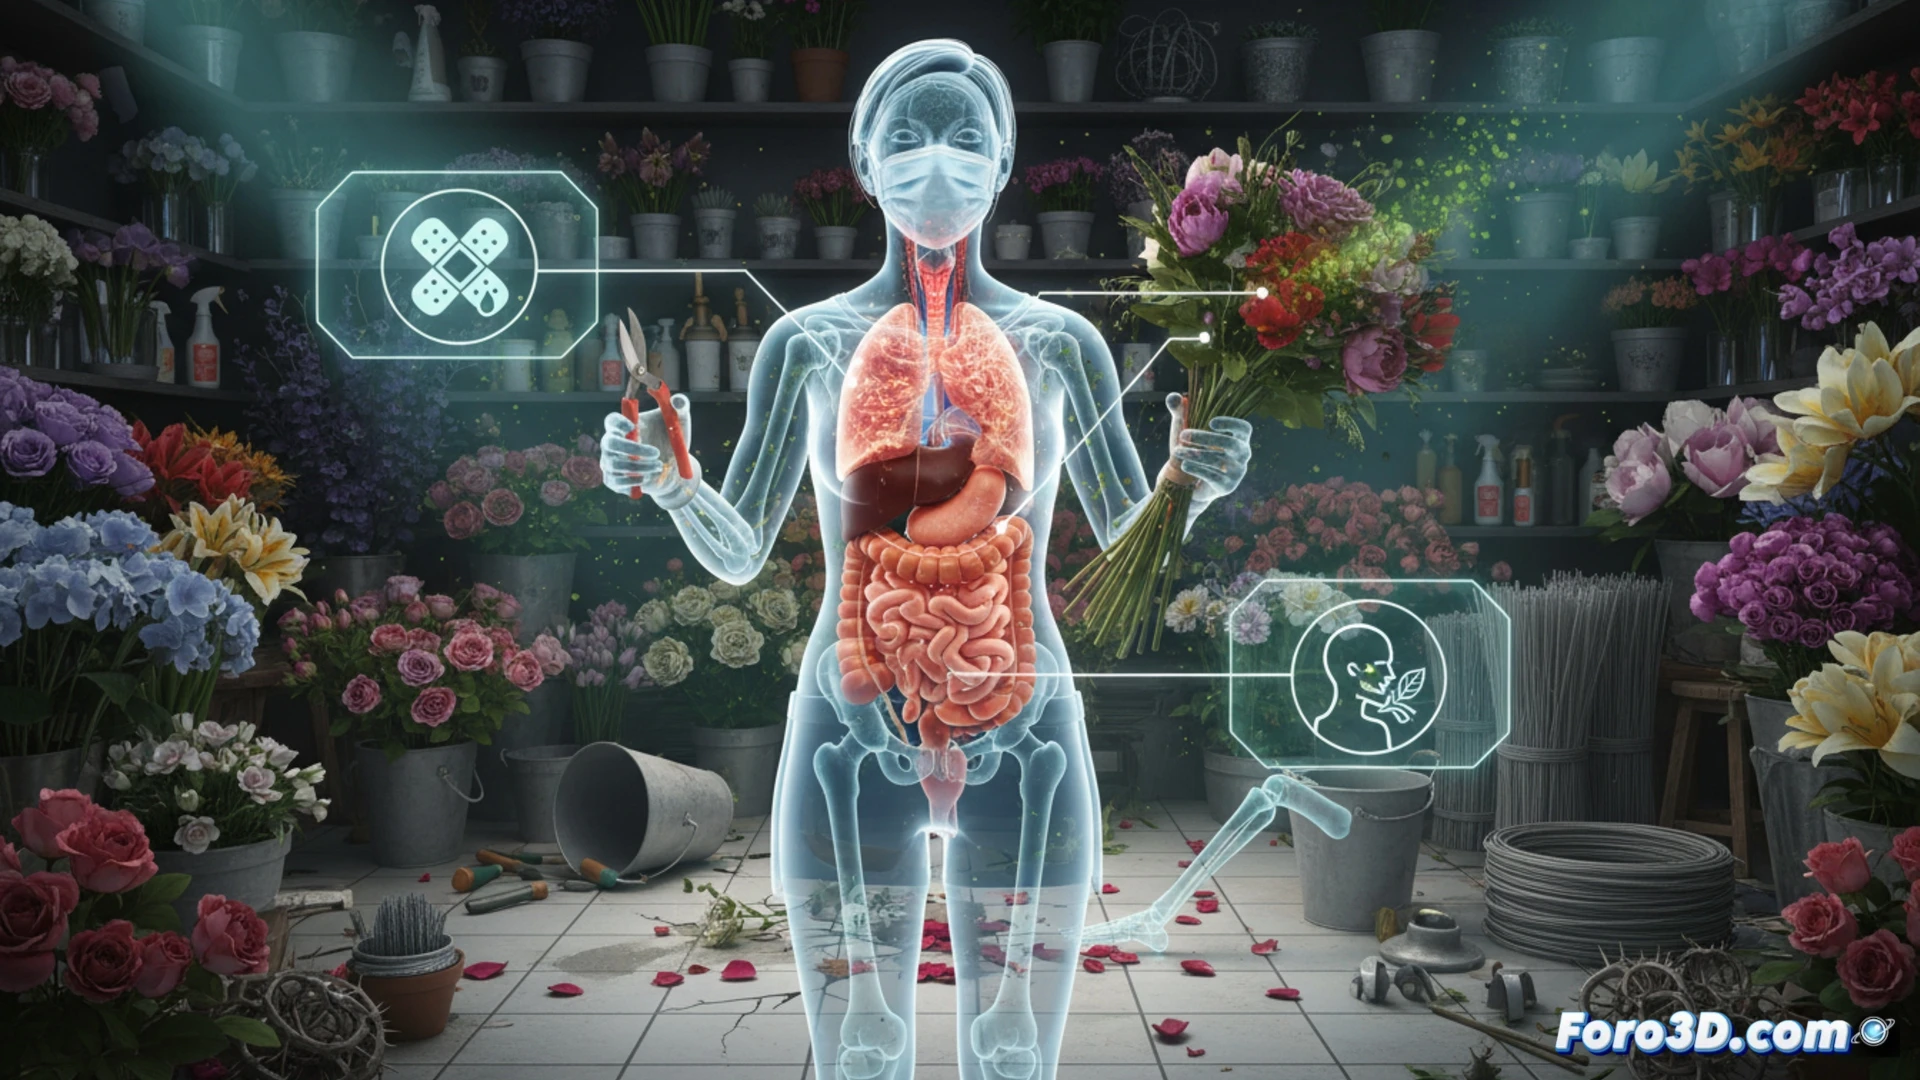
An interactive 3D infographic is ideal for representing this scenario. We can model an anatomical figure that highlights the most affected areas: the hands and forearms, where cuts from floral wire and thorns, as well as contact dermatitis from preservatives, are concentrated. The lumbar spine would light up to indicate overexertion when handling water buckets and pots. A dynamic bar chart could show the prevalence of respiratory allergies from exposure to soil fungi, while a risk thermometer would indicate the frequency of falls in greenhouses. This visual mapping translates accident data into an immediate prevention tool.
Floral aesthetics at the expense of health? ⚠️
The florist's paradox is that their work, dedicated to beauty and plant life, exposes them to harmful chemical and biological substances. The epidemiological perspective forces us to ask whether current regulations adequately protect these workers. Visualizing in 3D the journey of an allergen from the soil to the respiratory tract humanizes the statistics and underscores the urgency of implementing hygiene protocols, certified gloves, and active breaks as non-negotiable measures in the workplace.
How can 3D modeling of the florist's repetitive movements and forced postures when handling stems and thorns reveal ergonomic risk patterns not detected by traditional visual epidemiology?
(PS: 3D incidence maps look so good they almost make being sick enjoyable)