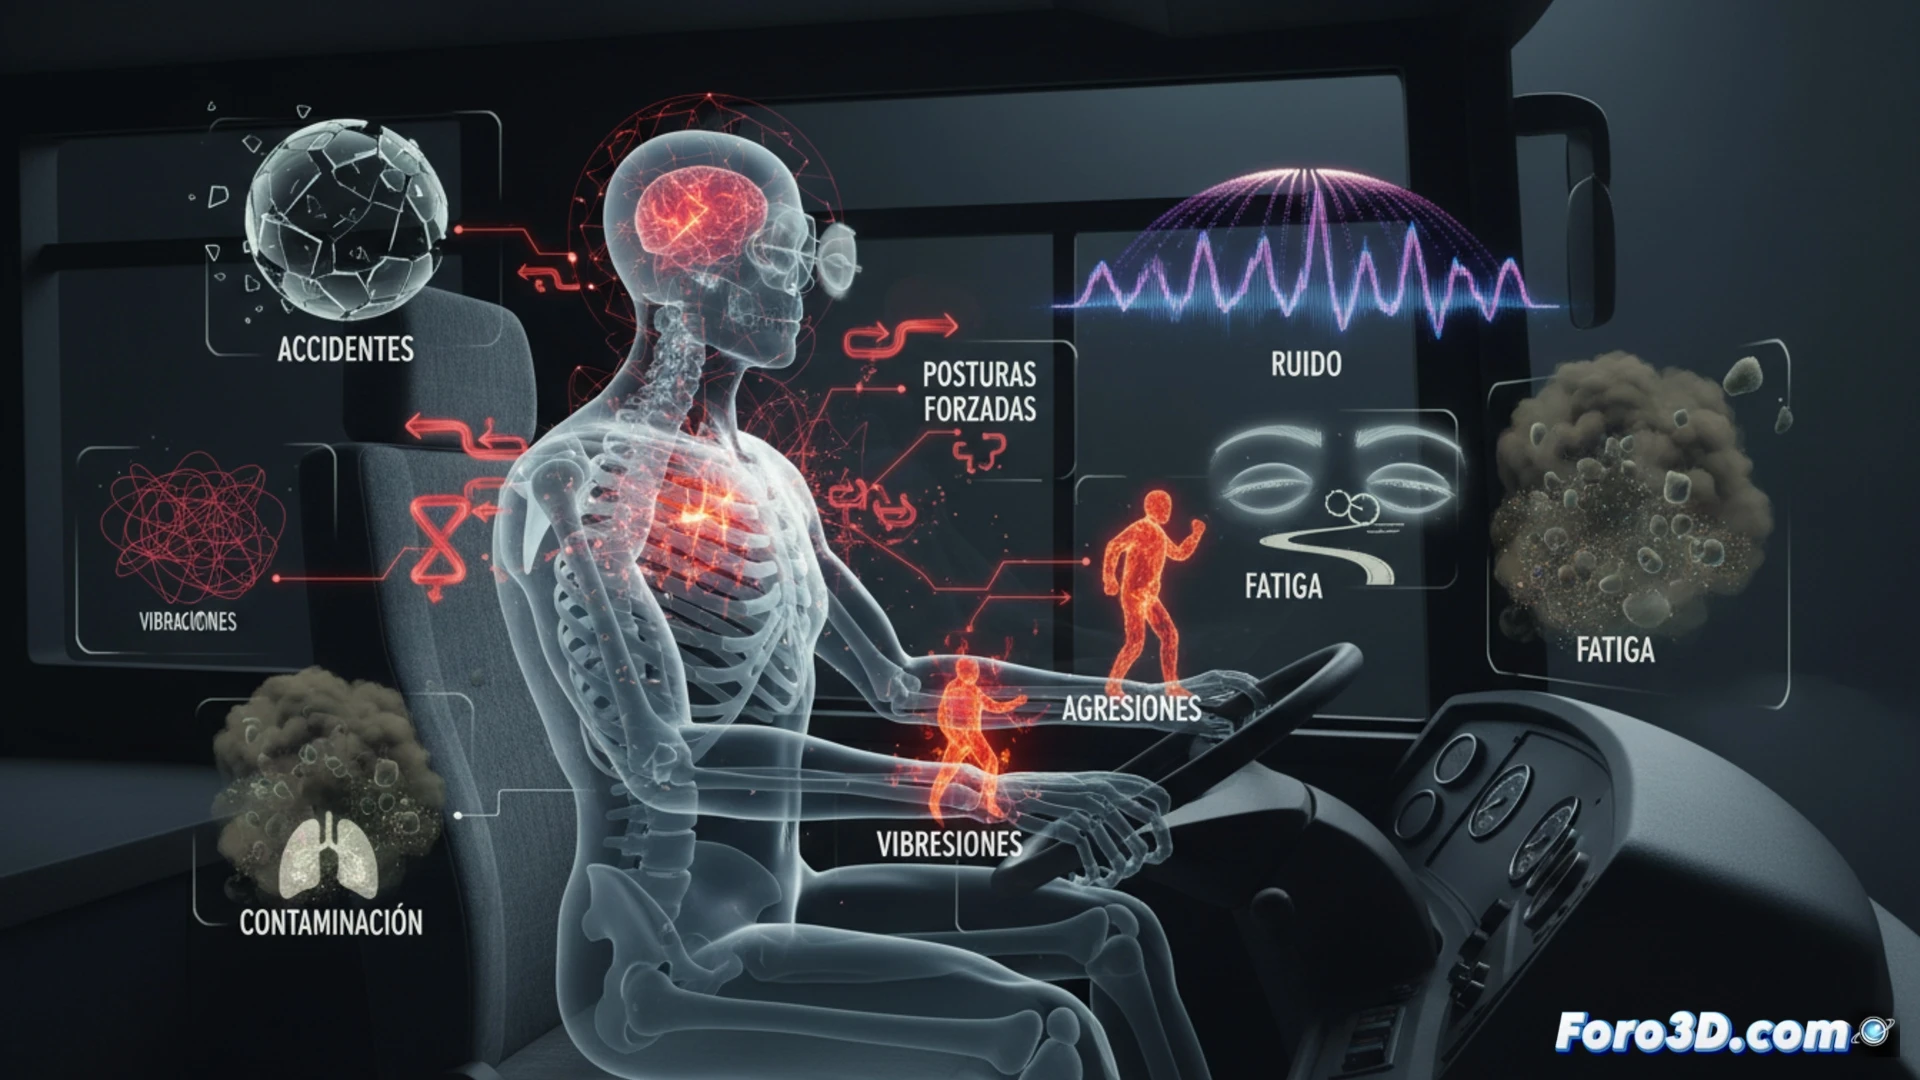
The occupation of bus driver concentrates a lethal combination of risk factors: traffic accidents, static forced postures, constant vibrations, ambient noise, chronic stress from traffic and schedules, passenger assaults, cumulative fatigue, exposure to pollution, and digestive disorders. Visual epidemiology allows transforming these abstract data into interactive three-dimensional models to understand their real impact on public health.
Epidemiological modeling of occupational risks 🚌
An interactive 3D infographic can represent the incidence of each occupational risk in bus drivers compared to other professions such as taxi drivers or delivery workers. Georeferenced heat maps would highlight urban areas with higher accident rates, while biomechanical simulations would show the forced postures leading to chronic lower back pain. Volumetric graphs would allow comparing exposure to whole-body vibrations, engine noise, and pollutant particles, revealing patterns that flat statistical analysis fails to highlight.
Visualized prevention for public policies 🛡️
3D visualization not only identifies hidden correlations between irregular schedules and digestive disorders but also allows designing specific interventions. For example, simulations of anti-vibration seat rotation or alternative routes with lower traffic density. By making invisible risks tangible, this tool facilitates communication among epidemiologists, transport companies, and unions, accelerating the implementation of measures that reduce fatigue and stress in a group essential for urban mobility.
How can 3D modeling of the forced postures and repetitive movements of the bus driver reveal biomechanical patterns that affect their long-term visual health?
(PS: the 3D incidence maps look so good that it's almost a pleasure to be sick)