The profession of a biologist, both in the laboratory and in the field, exposes professionals to a constellation of risks ranging from pathogenic biological agents to chronic stress. For public health and visual epidemiology, these hazards represent an ideal field of study for three-dimensional representation. This article explores how 3D modeling and interactive infographics can transform abstract accident data into incidence maps, propagation simulations, and contagion routes, improving prevention and occupational safety training.
3D Modeling of Exposures: Pathogens, Allergens, and UV Radiation 🧬
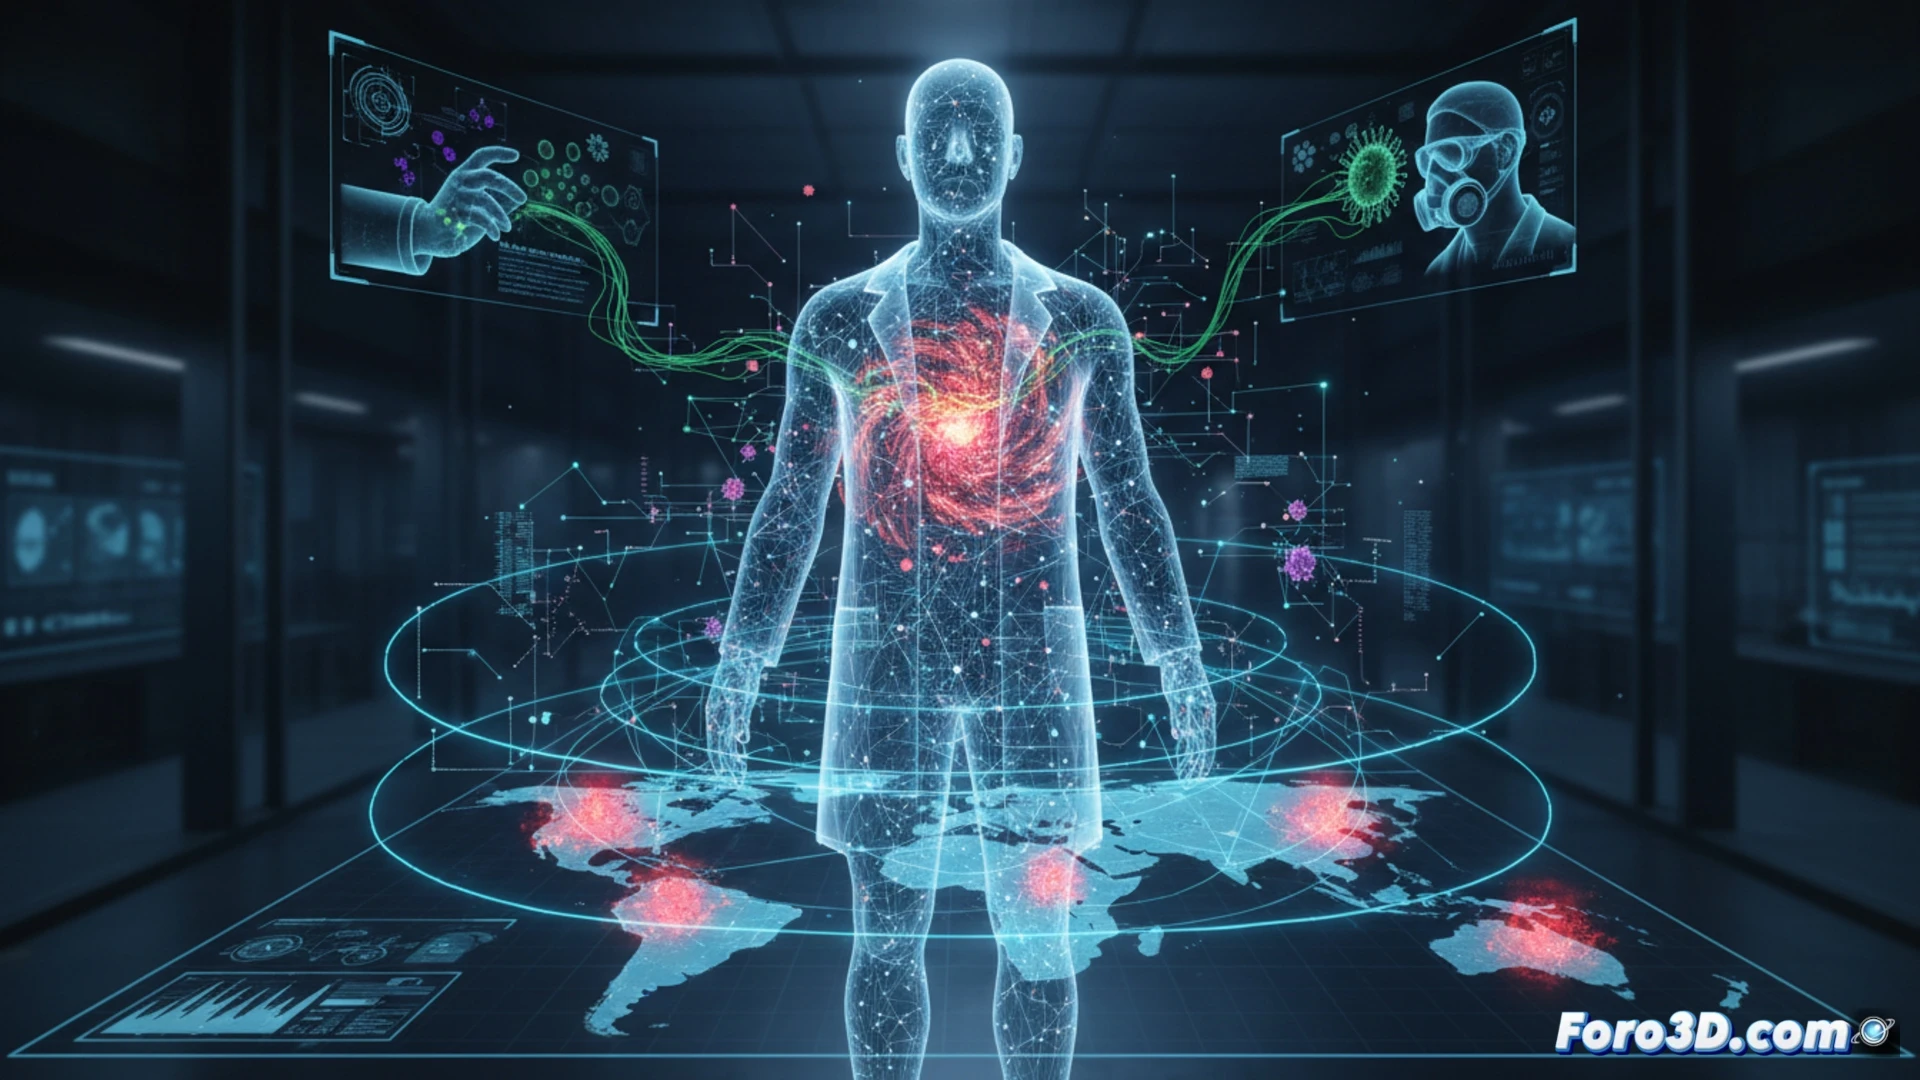
A deep technical analysis requires visualizing risks in their spatial context. In the field, 3D incidence maps can overlay satellite data of UV radiation with the density of dangerous fauna and fall zones, allowing for the prediction of high-risk seasonal areas. In the laboratory, 3D computational fluid dynamics (CFD) simulations model the spread of aerosols containing allergens or toxins after a spill, identifying ventilation blind spots. Additionally, interactive graphs of occupational stress can be represented as 3D neural networks, where each node shows workload, pathogen exposure, and fatigue, facilitating the identification of hidden correlations between biological and psychological variables.
From Passive Protection to Preventive Simulation 🛡️
The true innovation lies not only in representing risk but in anticipating it. 3D infographics of personal protective equipment (PPE), such as gloves, masks, and suits, can be broken down into interactive layers showing their effectiveness against punctures or cuts. By integrating these models with real-time exposure data, digital twins of the biologist are created that simulate contagion routes before they occur. This approach not only educates but transforms prevention into a dynamic and visual tool, essential for reducing accident rates in a profession vital to science.
How can 3D visualization of epidemiological data transform the identification and mitigation of hidden biological risks in the biologist's work environment?
(PS: modeling health data is like going on a diet: you start with energy and end up giving up)