Astronomy, often idealized as a romantic profession of stargazing, hides a complex work reality full of risk factors. From eye strain caused by long hours in front of screens and telescopes, to hypoxia at high-altitude observatories, sky professionals face physical and mental challenges rarely depicted in the media. Analyzing these risks is not only crucial for the scientist's health but also offers a fascinating field for scientific visualization and 3D modeling.
Modeling risk environments: from the night observatory to the office 🌌
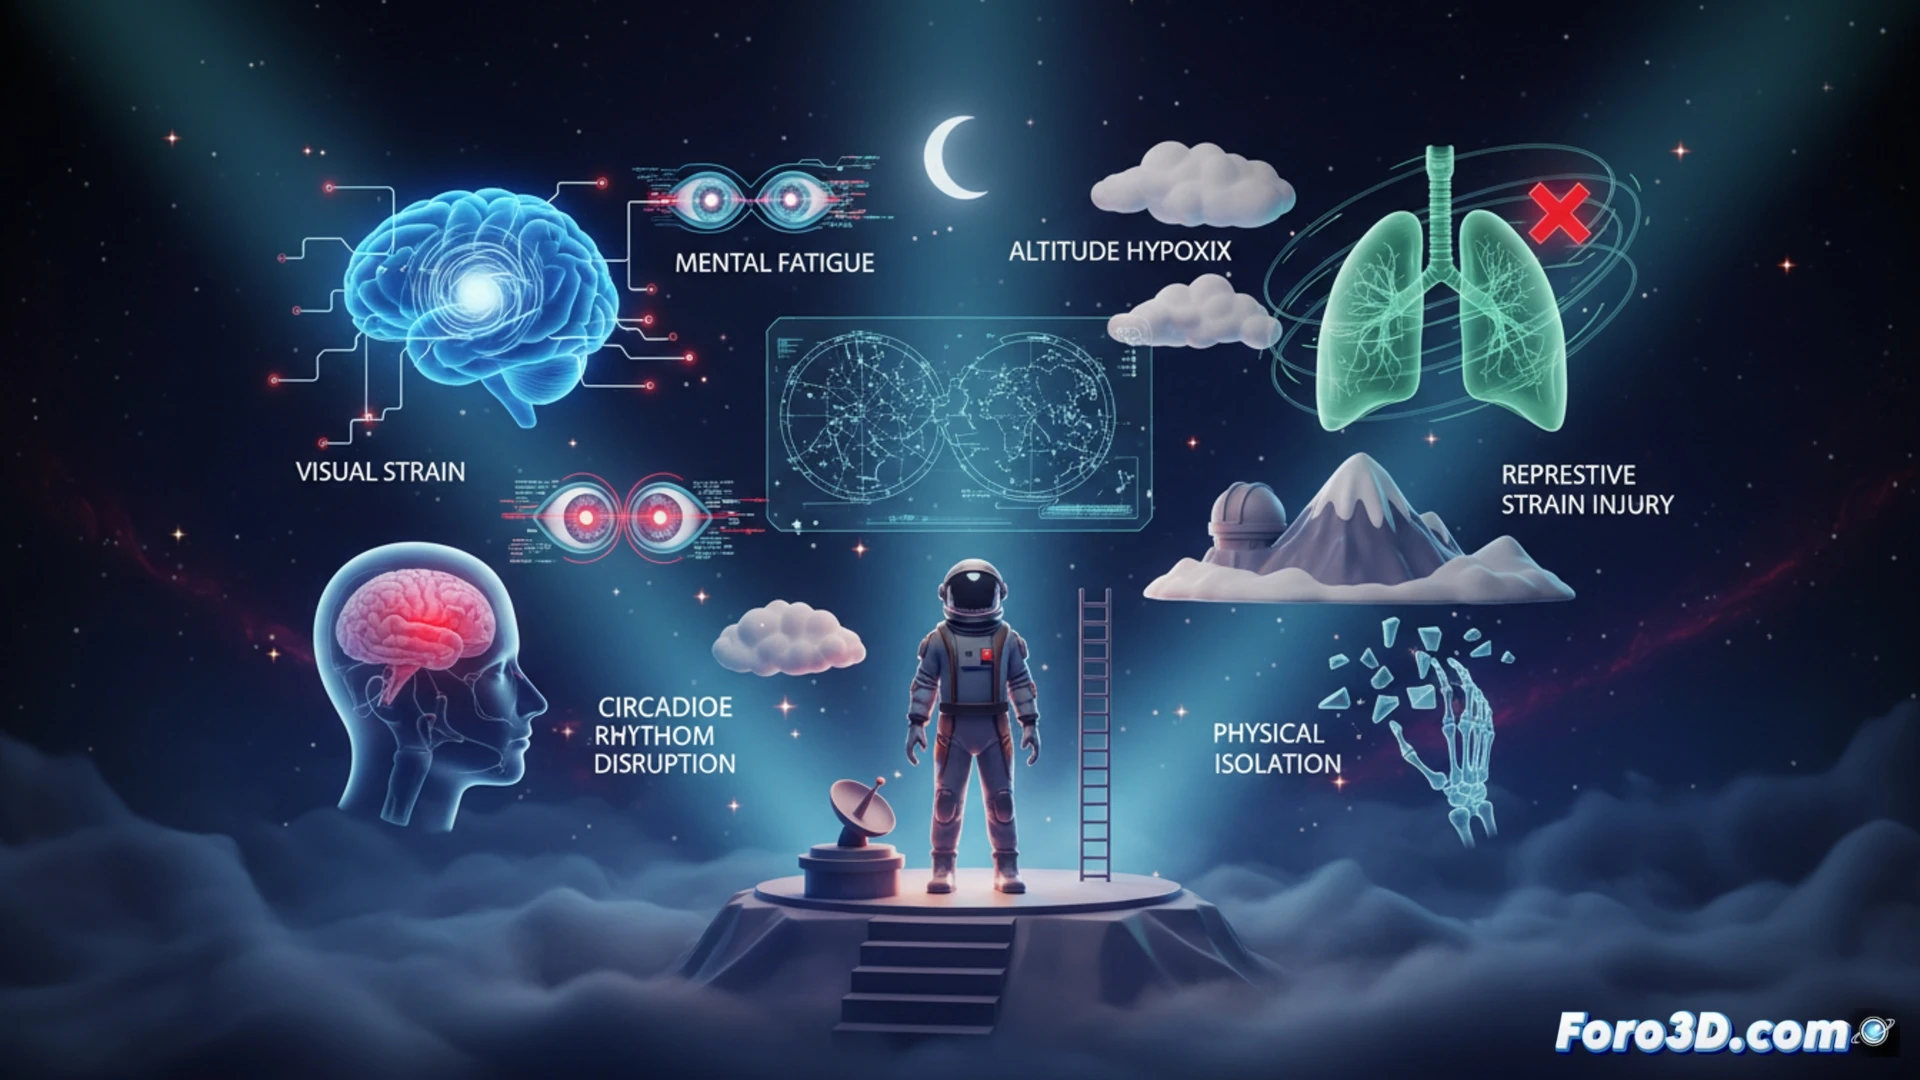
Creating an interactive 3D infographic allows breaking down the three key scenarios of the modern astronomer. In the first module, the nighttime environment, eye strain would be simulated using a cold blue color gradient and animated flashes representing accumulated ocular fatigue. The second module addresses high-altitude work: a topographic mountain model with heat maps indicating hypoxia zones and fall risks, accompanied by data on respiratory effort. The third module, the office, would show a virtual desk with stress icons (publication deadlines, data management) and a sedentary hours counter. This representation not only educates but allows the user to explore each risk factor through clicks and rotations, transforming abstract data into an immersive experience.
The science behind the effort: humanizing data with 3D 🧠
Beyond the technique, this infographic seeks to humanize the figure of the astronomer. By visualizing sleep disorders from inverted schedules with a distorted biological clock or mental overexertion with stress particles orbiting the avatar's head, the user understands that exploring the cosmos has a tangible human cost. For the Scientific Visualization niche, this project is not only a prevention tool but an example of how 3D can serve as a bridge between occupational statistics and visual empathy.
How can a 3D infographic effectively represent the invisible occupational hazards of an astronomer, such as digital eye strain and exposure to cosmic radiation, to make the science behind their craft tangible?
(PS: fluid physics for simulating the ocean is like the sea: unpredictable and you always run out of RAM)