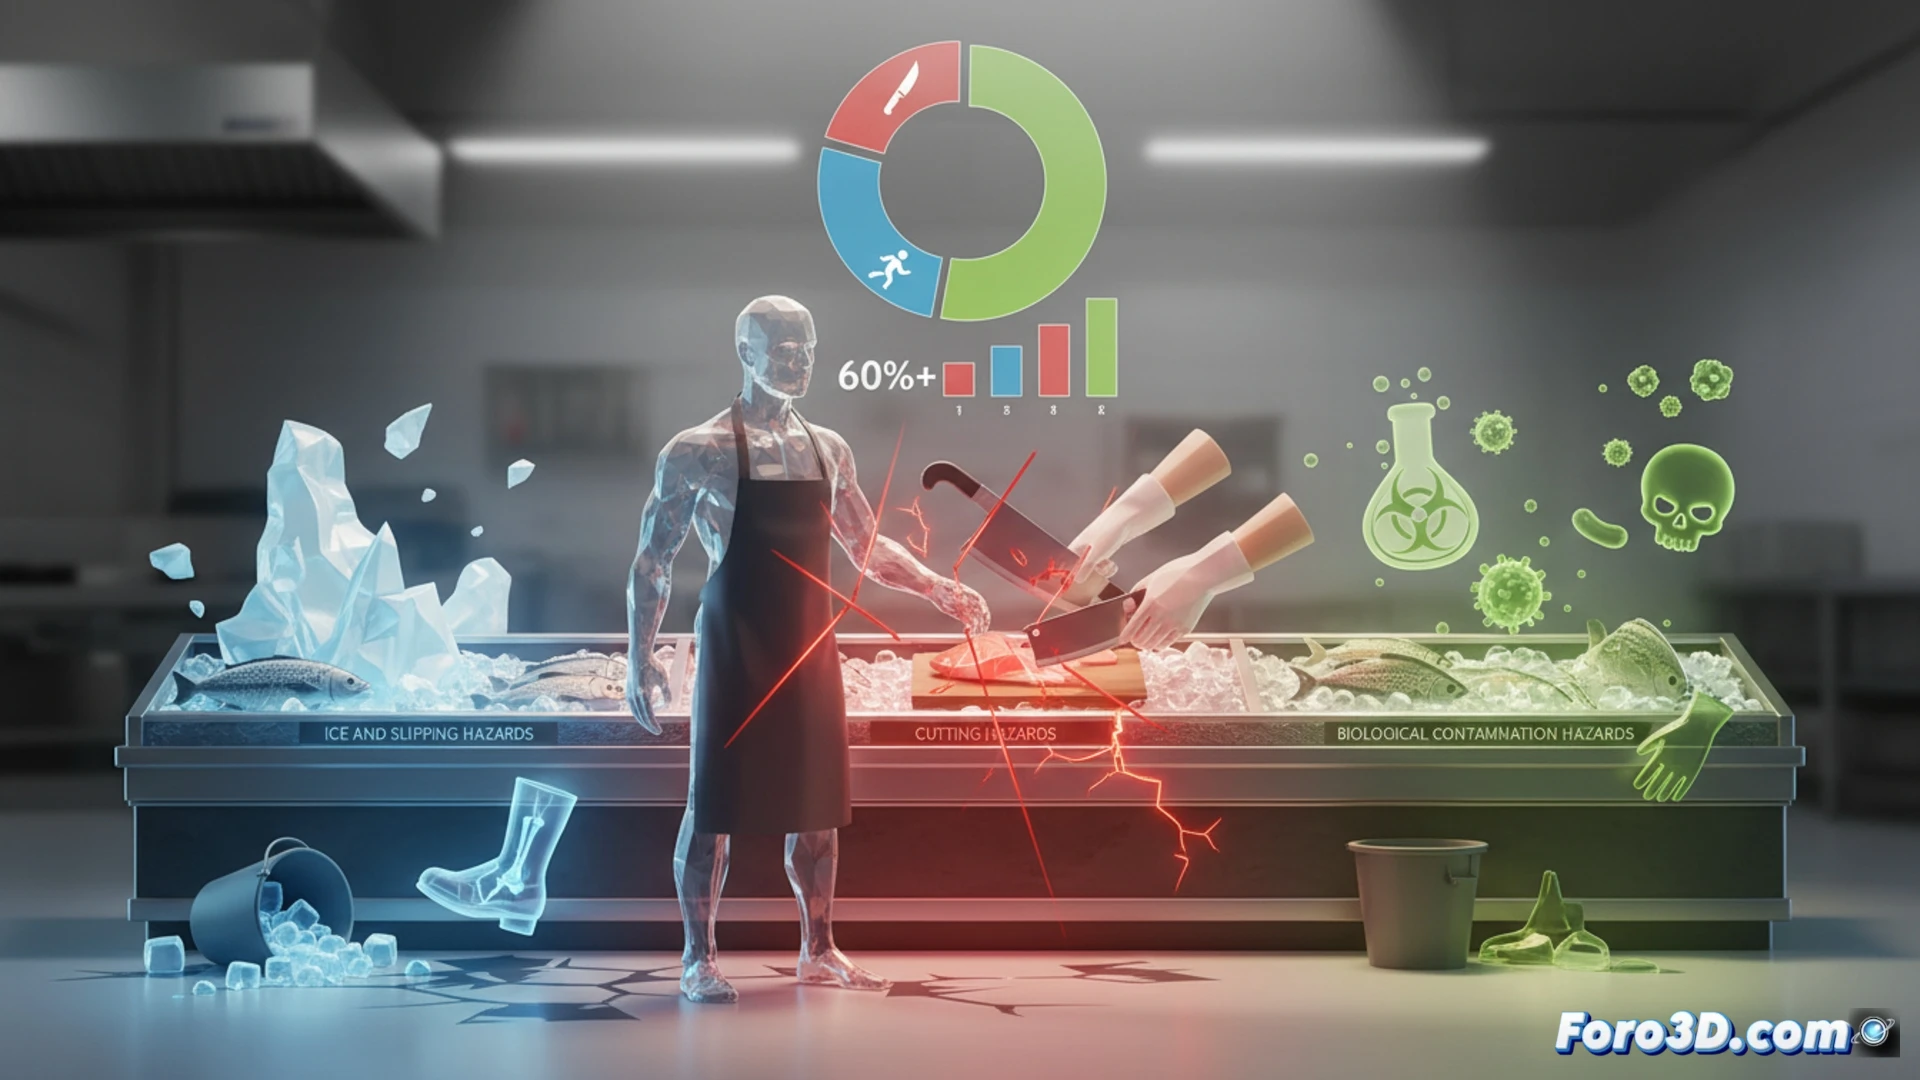
The trade of fishmonger combines exposure to extreme cold, slippery surfaces, and sharp tools, generating a complex risk profile. From a visual epidemiology perspective, representing these hazards in 3D allows for identifying critical points such as cutting areas, ice accumulation zones, and sources of biological contamination. This graphical approach facilitates the understanding of real statistical data from the fishing sector, where cuts and falls account for more than 60% of reported accidents.
Mapping of critical zones and anatomical models of injuries 🧊
The proposed 3D infographic segments the workstation into three high-risk areas: the cutting table, where knives and fish bones cause lacerations to hands and forearms; the floor next to cold storage rooms, with a high incidence of falls due to condensation and ice; and the loading area, where lifting boxes weighing up to 25 kilos generates lumbar strain. Rotatable anatomical models are incorporated showing the most common injuries: deep cuts to fingers, tendinitis from repetitive movements, and dermatitis from contact with bacteria such as Vibrio vulnificus. Incidence charts, based on data from the National Institute for Safety and Health at Work, reveal that punctures from fish bones account for 35% of minor accidents, while cold exposure causes 12% of sick leave due to occupational diseases.
Visualizing to prevent: from data to habit change 🔪
The visual representation of these risks not only informs but transforms the worker's perception of their environment. By seeing in 3D how poor posture when lifting a box compresses the spinal discs, or how prolonged contact with ice reduces circulation in the fingers, the fishmonger internalizes the need to use cut-resistant gloves, non-slip footwear, and active breaks. This educational tool, accessible from mobile devices, can reduce the incidence of accidents in the sector by up to 40% if integrated into mandatory training programs.
How can a 3D infographic dynamically represent the interaction between extreme cold, slippery surfaces, and sharp tools to predict and prevent workplace accidents in fishmongers?
(PS: visualizing obesity in 3D is easy; the hard part is making it not look like a map of solar system planets)