Gardening, often perceived as a low-risk activity, hides a complex injury profile that combines physical trauma, chemical exposure, and environmental factors. This article analyzes the occupational risks of gardeners from the perspective of Public Health and Visual Epidemiology, using 3D models to map the incidence of pathologies and create interactive dashboards that facilitate prevention.
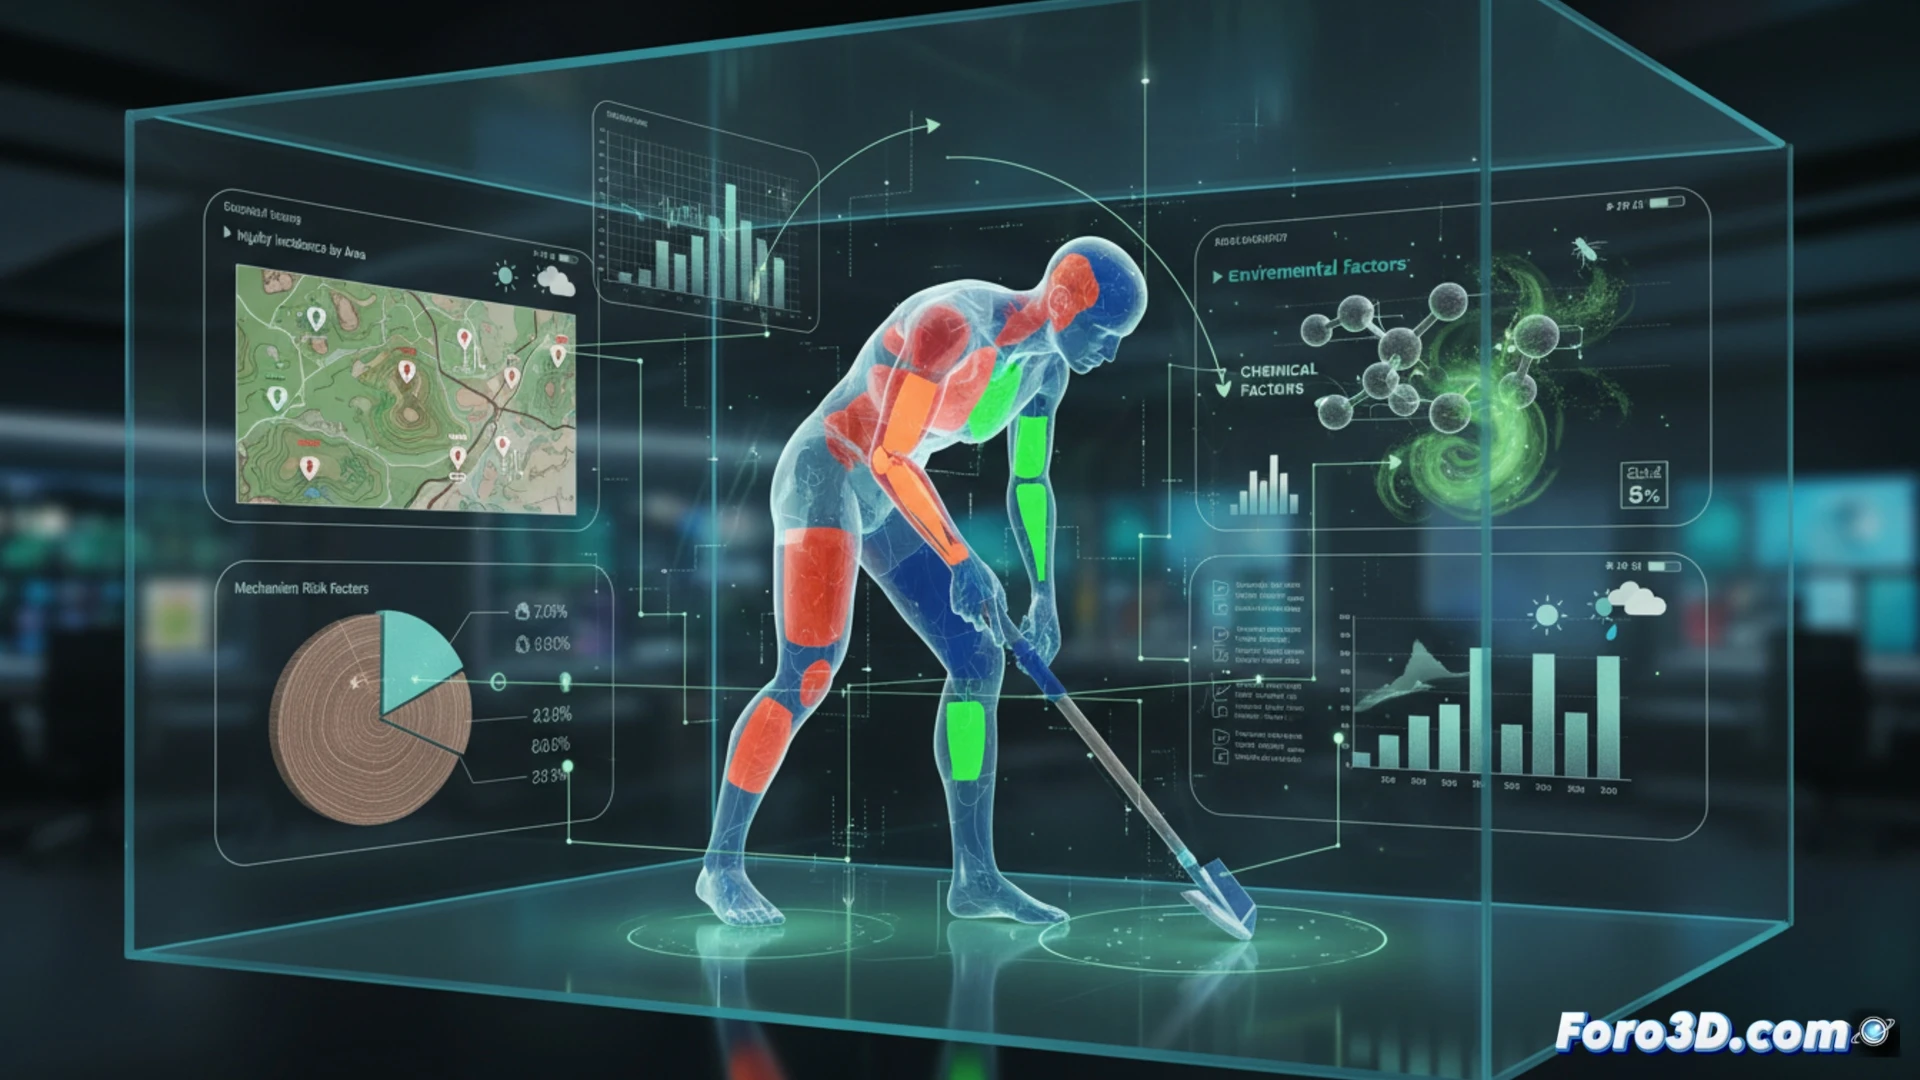
3D body mapping and poisoning incidence charts 🧑🌾
Three-dimensional visualization allows for accurately representing the body areas most affected by forced postures, such as the lumbar spine when bending or the knees when working on the ground. Using an interactive body heat map, these points can be correlated with the incidence of lower back pain and bursitis. Likewise, 3D bar charts show the temporal evolution of poisonings from phytosanitary products (herbicides, insecticides, fungicides), highlighting seasonal peaks and regions with a higher prevalence of dermatitis. Simulations of UV radiation exposure and chainsaw noise complete the picture, projecting cumulative risk levels throughout the workday.
Towards visual and predictive prevention 📊
The integration of epidemiological data into 3D environments not only informs but transforms prevention. An interactive dashboard allows occupational health services to visualize the spread of pollen and plant allergies at different times of the year, or model the effect of weather conditions on the risk of falls on uneven terrain. By converting abstract statistics into spatial and temporal representations, this tool facilitates decision-making and promotes a safety culture based on clear visual evidence.
How could 3D visualization of epidemiological data reveal hidden patterns of injuries in gardeners that conventional statistics overlook, and what implications would this have for public health prevention?
(PS: modeling health data is like going on a diet: you start with energy and end up quitting)