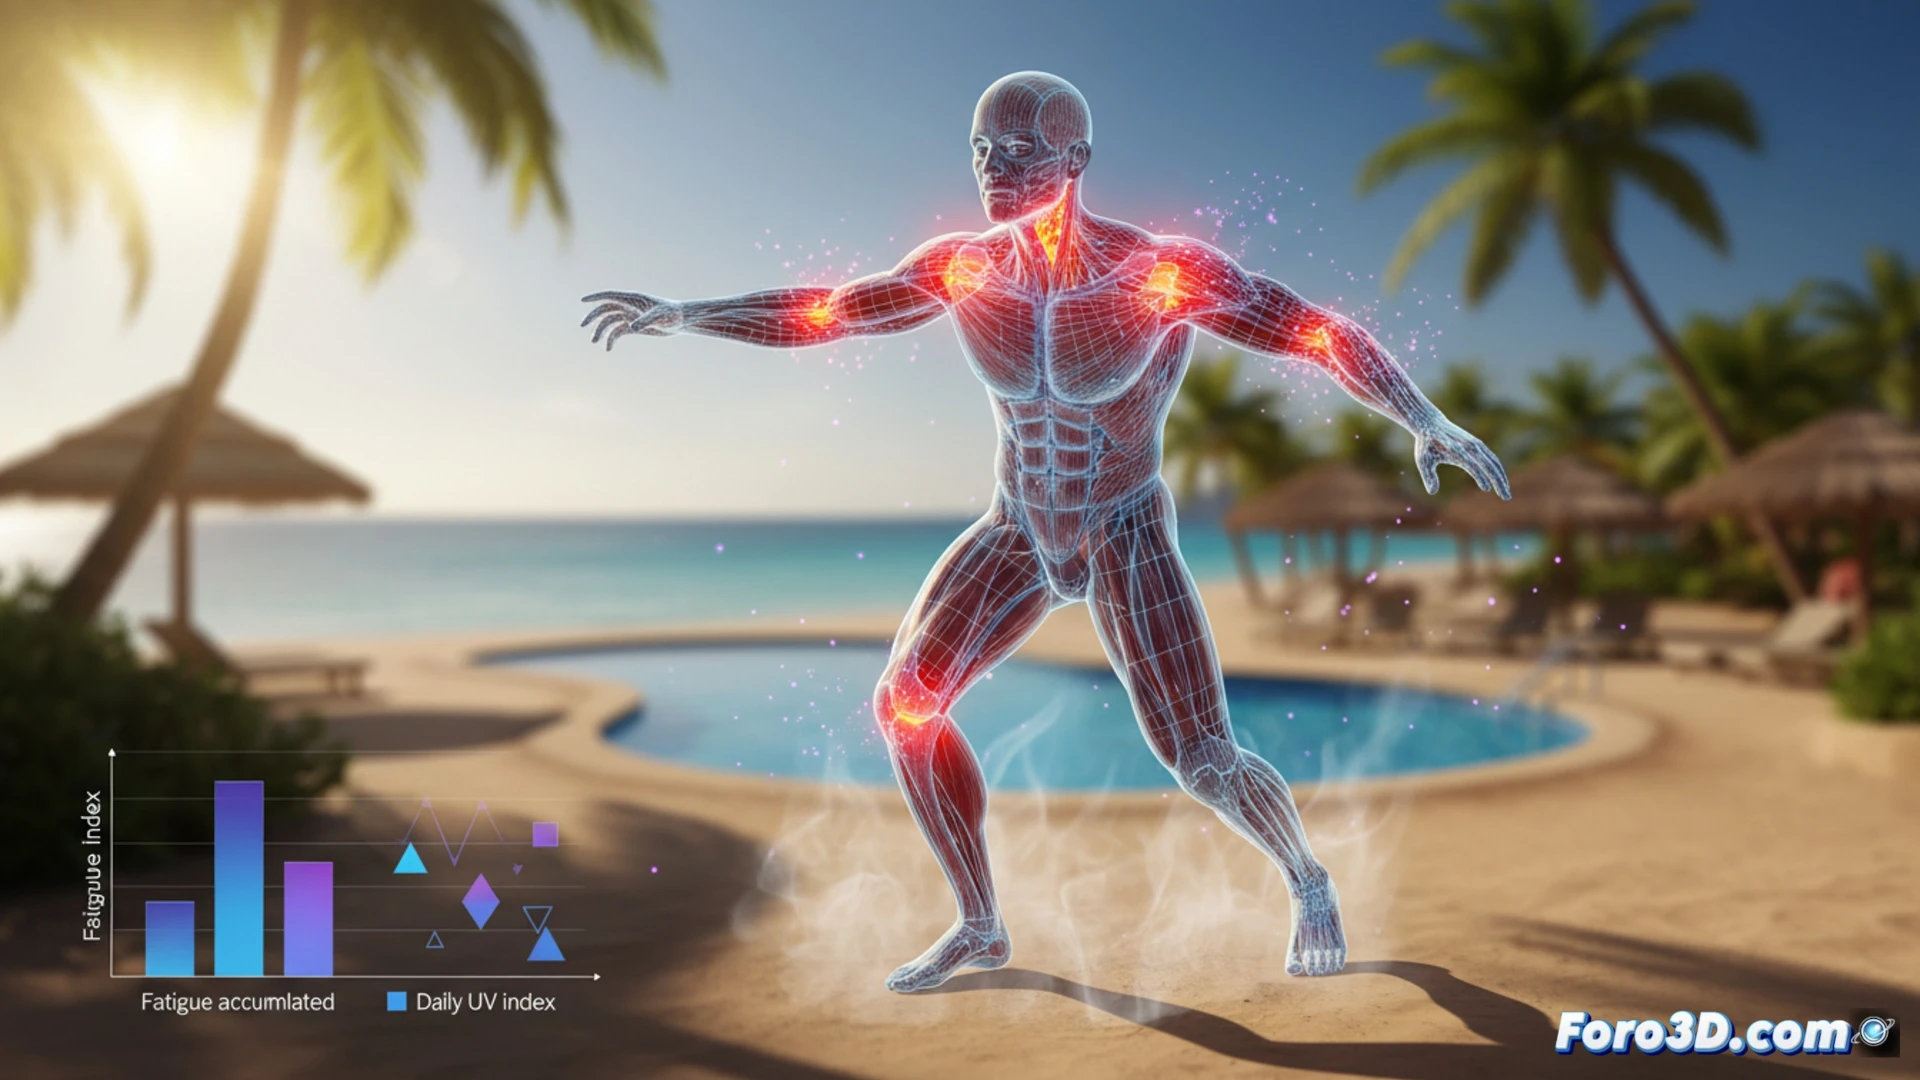
The entertainment animator combines sport, games, and customer service in shifts that often exceed ten hours. This epidemiological analysis visualizes, using a 3D body heat map, the distribution of the main occupational risks: overexertion in limbs, sun exposure on the head and shoulders, falls on knees and ankles, and stress manifesting as neck tension. The tool allows correlating accumulated fatigue with UV radiation intensity throughout the day.
Visualization methodology and temporal correlation 🕐
A typical eight-hour shift was modeled, from 10:00 to 22:00, with peaks of physical activity at 11:00 and 17:00. The body map assigns colors from blue (low impact) to red (high impact) based on the incidence of each risk. The lower limbs register 40% of the load from jumps and runs; the lumbar area, 25% from forced postures; and the scalp, 20% of accumulated UV exposure. A superimposed temporal graph shows how subjective fatigue (Borg scale) rises from 6 to 15 between 14:00 and 18:00, coinciding with the peak of solar radiation.
Visible prevention: data that protects the group 🛡️
The 3D visualization not only describes the problem but also suggests interventions: rotate high-impact activities every 45 minutes, install shaded areas in animation zones, and schedule mandatory breaks between 12:00 and 16:00. For public health, this model allows calculating the relative risk of accumulated injury per season. The animator ceases to be a statistical number and becomes a body with vulnerable areas that prevention can protect.
Considering that the entertainment animator performs continuous physical effort while emotionally managing large groups during shifts of more than ten hours, which specific anatomical areas show the greatest accumulation of muscle fatigue, and how does this three-dimensional pattern correlate with salivary cortisol peaks measured at different times of the day?
(PS: at Foro3D we know that the only epidemic affecting us is the lack of polygons)