A dam break can trigger a catastrophic flood in a matter of minutes. To anticipate these events, engineers turn to 3D modeling, a technique that combines high-resolution topographic data with hydraulic simulations. This article explains the technical process behind these simulations, from terrain acquisition to flow visualization, and their impact on the safety of populations and infrastructure.
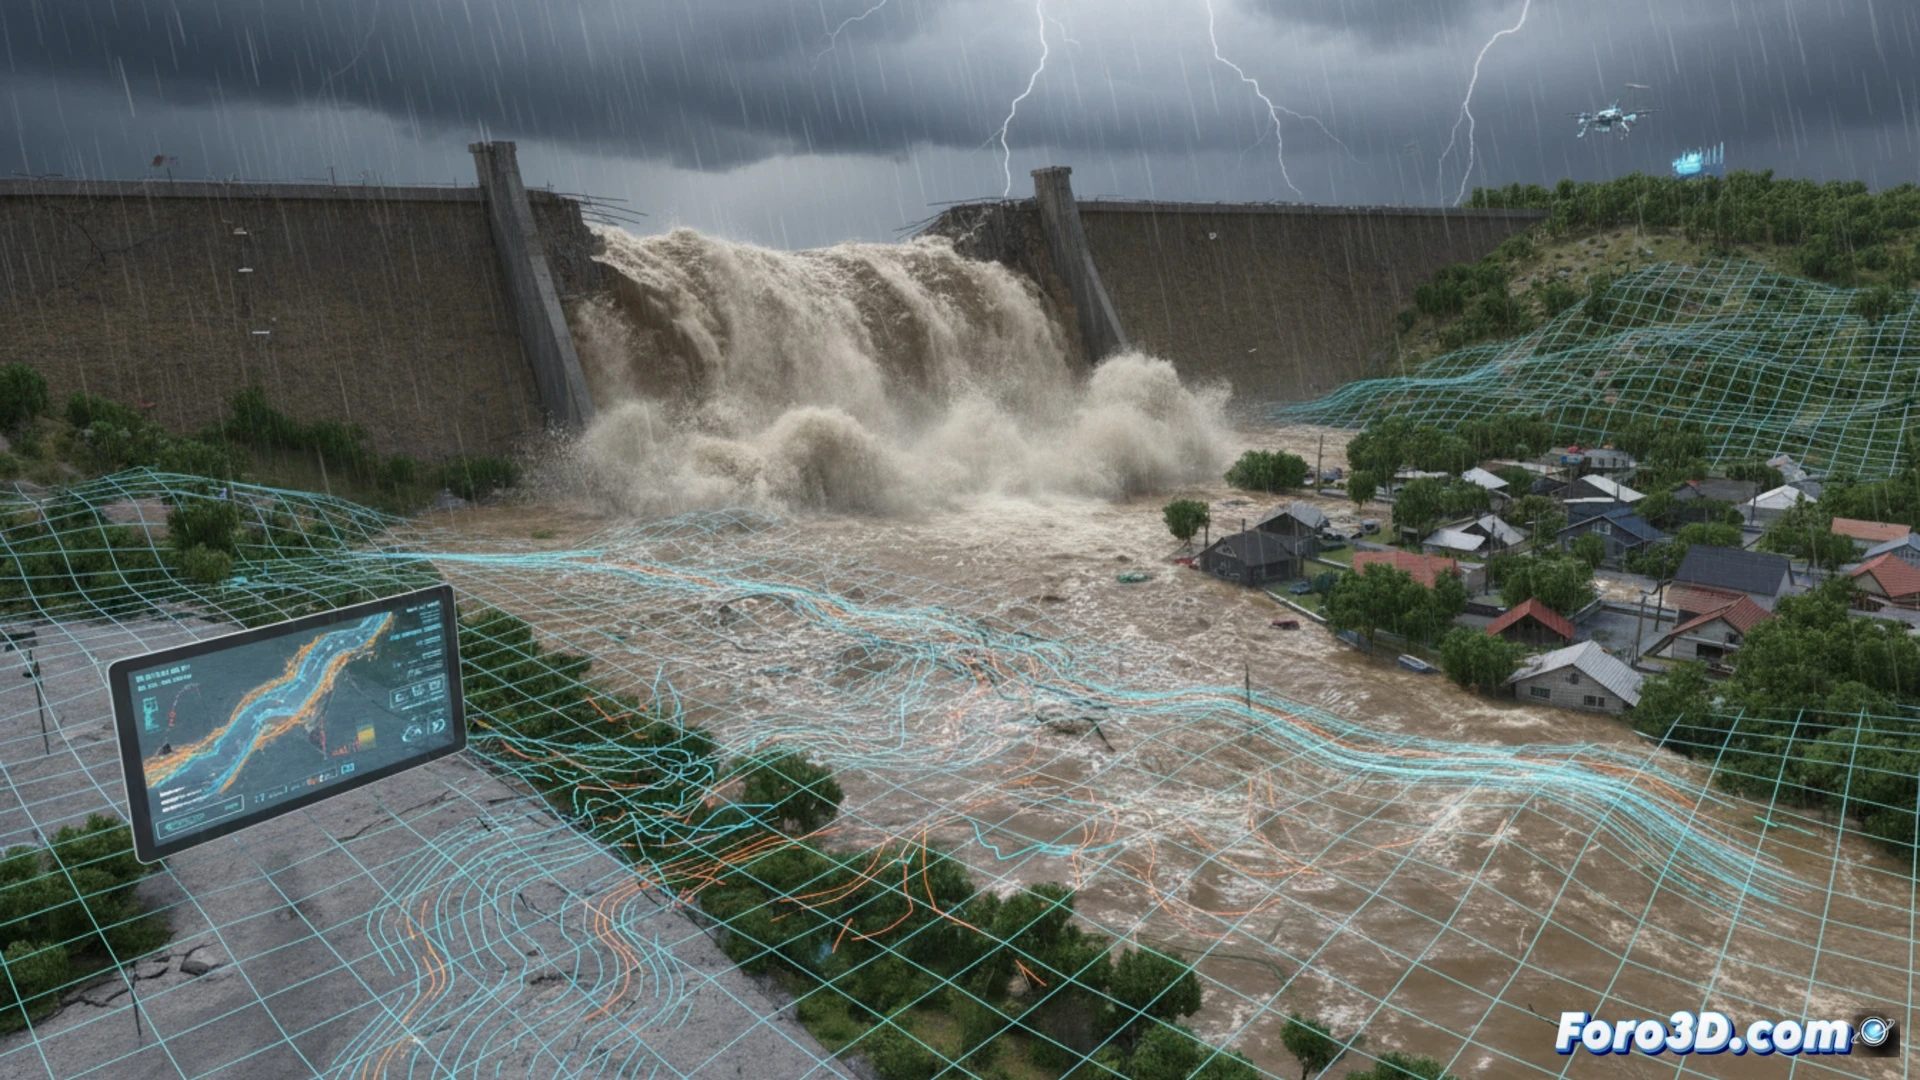
Technical workflow: data and simulation software 🌊
Modeling begins with a LIDAR survey or photogrammetry to generate a digital terrain model (DTM) with submetric precision. On this basis, software such as HEC-RAS or TUFLOW is applied, solving shallow water equations to calculate water velocity and depth after the failure. Parameterization includes the type of breach (gradual or instantaneous), reservoir volume, and terrain roughness. The result is a 3D animation showing the wave's advance, identifying flood zones, arrival times, and hydrodynamic pressures on buildings and bridges.
Applications in resilience and emergency plans 🛡️
These simulations allow for designing optimal evacuation routes, reinforcing weak points in existing dams, and assessing the risk of cascading failure. In urban planning, they help decide where to build critical infrastructure such as hospitals or power plants. Additionally, 3D models are integrated into early warning systems, providing emergency managers with a clear visualization of the disaster before it occurs, saving lives and reducing economic losses.
How to model in 3D the progression of a flood caused by a dam failure to predict impact zones and optimize structural prevention measures?
(PS: Simulating catastrophes is fun until the computer crashes and you are the catastrophe.)