Karst systems, formed by the dissolution of limestone rocks, are extremely vulnerable to contamination. When a chemical spill occurs, the pollutant travels through a network of invisible fissures and conduits from the surface. Predicting its path and locating the exact source of the spill is a technical challenge. Today, the combination of tools such as MODFLOW 3D, Leapfrog Hydro, QGIS, and ParaView allows for the construction of digital twins of these caves to simulate underground flow with millimeter precision.
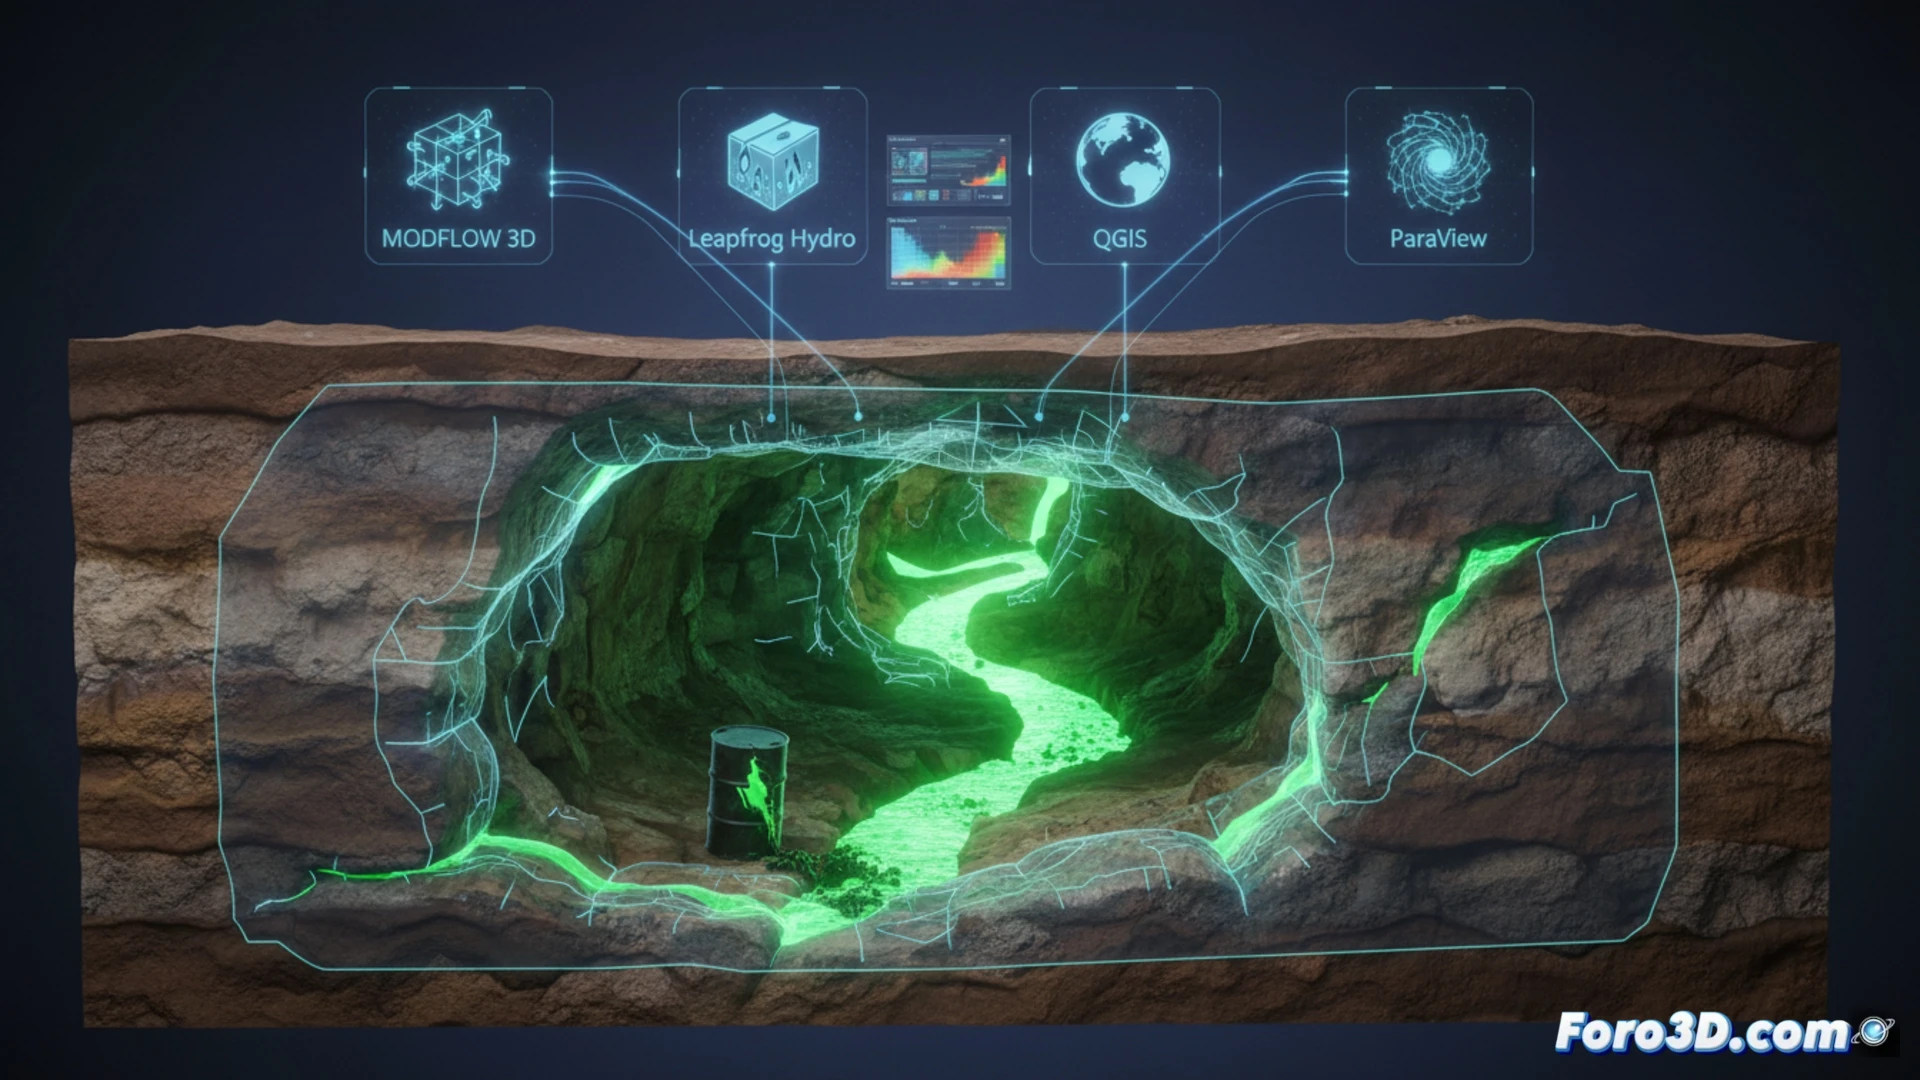
Simulation of pollutant flow with MODFLOW and Leapfrog Hydro 💧
The process begins with the integration of geological data into Leapfrog Hydro, which generates a 3D volumetric model of the network of cavities and fractures. On this framework, MODFLOW 3D solves the groundwater flow equations, allowing a pollutant to be virtually injected and its dispersion over time to be observed. QGIS is used to georeference sampling points and aquifer boundaries, while ParaView visualizes contaminant plumes in interactive animations. In a real case of solvent spill in a karst in Slovenia, this methodology managed to identify the point of origin 2 km away, something impossible with traditional surveys that only offer point data.
The advantage of prediction over late reaction ⏳
Classic investigation methods, such as fluorescent tracers or monitoring wells, require weeks of field work and often fail to detect secondary conduits. 3D simulation reduces that time to hours and allows testing remediation scenarios without environmental risk. For disaster managers, having a model that anticipates where a chemical spill in a karst will move is not just a technical advantage: it is the difference between containing a disaster or having to declare an aquifer lost forever.
How to model in 3D the underground flow of a chemical spill in a karst system to predict its propagation towards nearby aquifers
(PS: Simulating disasters is fun until the computer crashes and you are the disaster.)