The environmental engineer faces a professional paradox: they work to clean up the environment while their own health is exposed to multiple aggressors. From treatment plants to the office, their workday combines chemical, biological, and ergonomic risks. This analysis proposes a three-dimensional visualization of these hazards, integrating epidemiological data to create an interactive map that allows for anticipating and mitigating damage.
Three-Dimensional Exposure Modeling and Visual Epidemiology 🧬
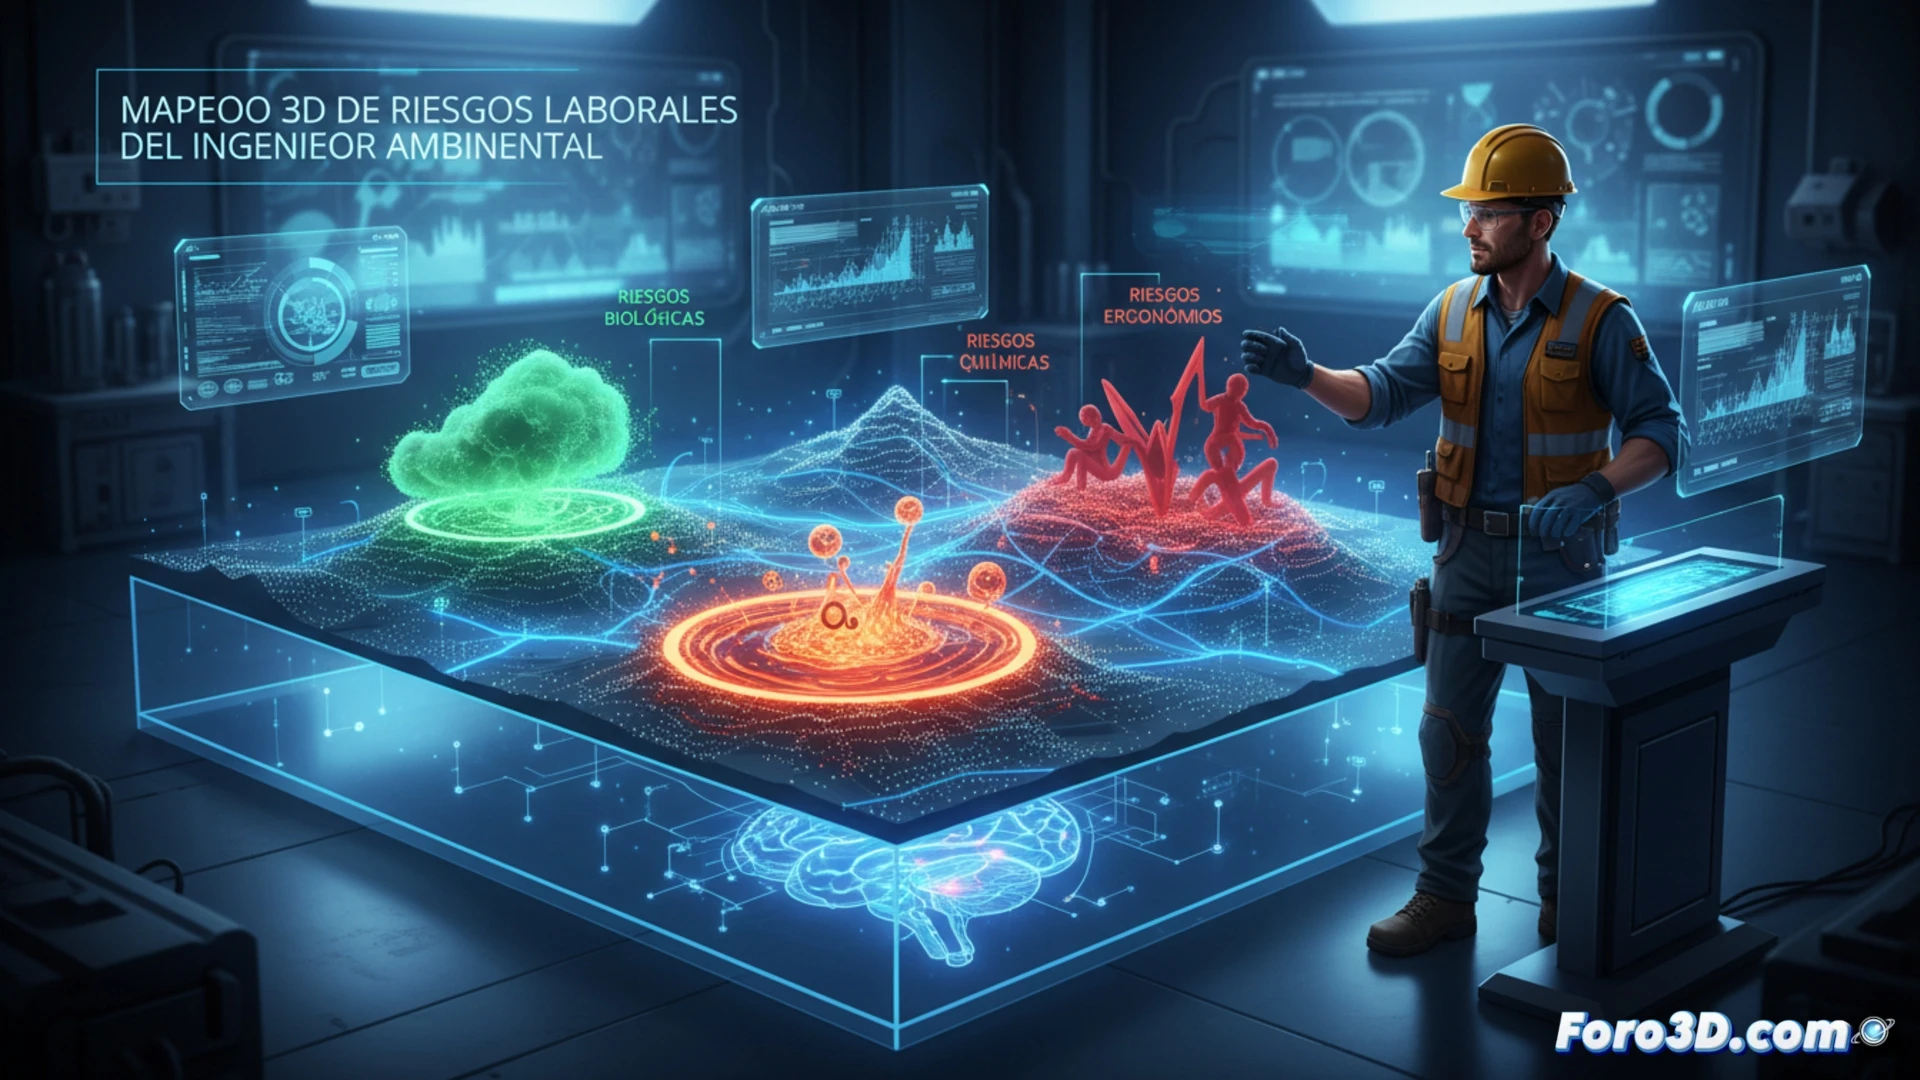
The proposed 3D infographic segments the workspace into three scenarios: treatment plant, landfill, and office. In the first scenario, particles of toxic gases (such as methane and hydrogen sulfide) are modeled with dispersion trajectories that affect the respiratory tract. In the landfill, biological contagion routes are simulated through contact with leachate or aerosols. For the office, factors such as eye strain from screens and muscle tension from prolonged sedentary behavior are represented. Each risk point is linked to incidence statistics for respiratory and musculoskeletal diseases, allowing the user to rotate the model and visualize the correlation between location and pathology.
The Invisible Burden of the Environmental Guardian 🧠
Beyond physical dangers, stress from deadlines and projects accumulates a mental toll that is rarely mapped. The pressure to comply with regulations and the responsibility for hazardous waste generate cognitive fatigue which, combined with frequent vehicle travel, creates a comprehensive risk profile. This 3D visualization aims to make that hidden burden visible, offering professionals and occupational health departments a tool to design more humane and effective prevention protocols.
Is it possible to model in 3D the spatiotemporal patterns of exposure to pollutants to predict the synergistic risk of visual diseases in environmental engineers during soil remediation?
(PS: at Foro3D we know that the only epidemic affecting us is the lack of polygons)