Physics laboratories are highly complex environments where multiple silent threats converge: from ionizing radiation to electromagnetic fields. Each area, whether a cryogenics workshop or a laser optics bench, presents a unique risk profile. Scientific visualization offers a powerful tool for modeling these hazards, transforming invisible abstractions into clear visual warnings, enhancing the safety of technical personnel.
Modeling High-Risk Environments: Radiation, Cryogenics, and Electricity 🧪
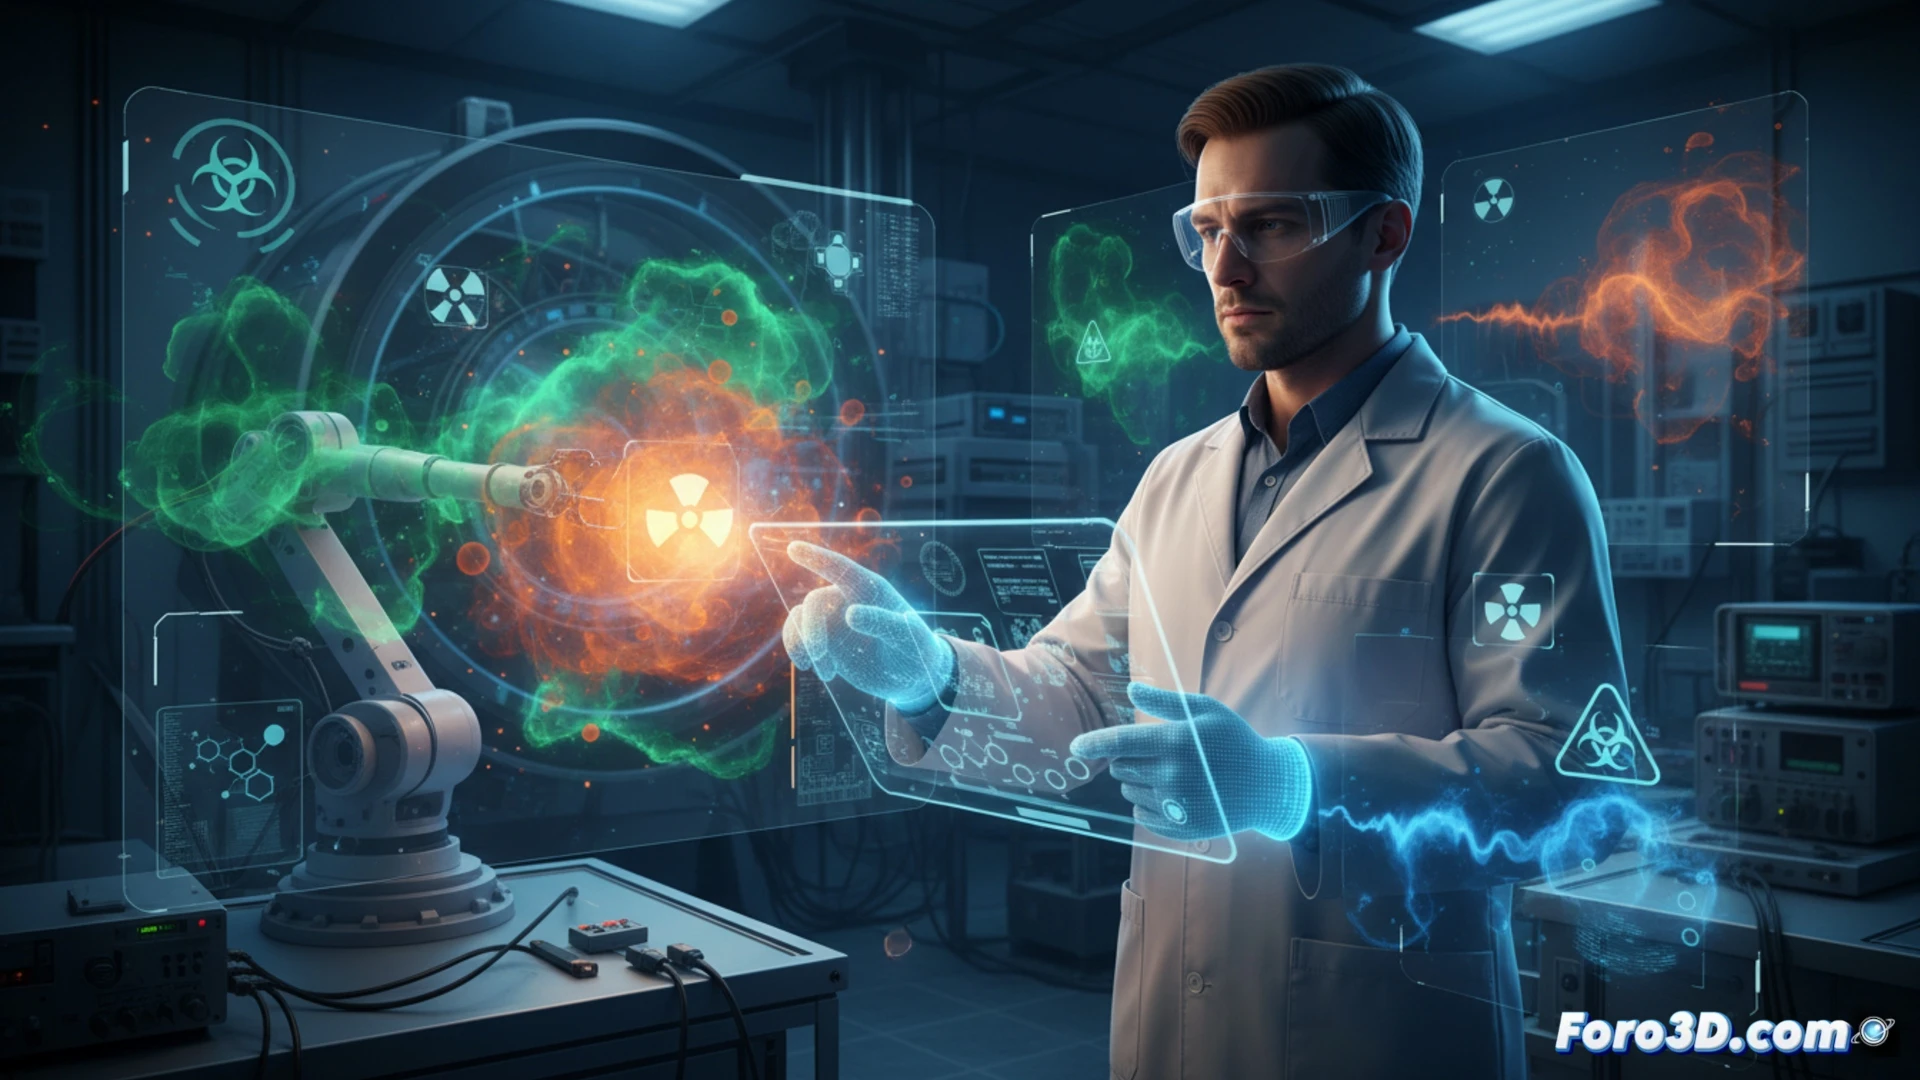
An interactive 3D model allows the workspace to be segmented into differentiated risk areas. For example, in the cryogenic equipment zone, the model can simulate cold gas clouds and icy surfaces, while in the laser area, beam cones and dangerous reflection zones are traced. Hot spots are marked with animated icons: a trefoil for ionizing radiation, a spiral for electromagnetic fields, and a lightning bolt for electrical risk. Interacting with each icon displays technical data such as exposure levels in microsieverts per hour or field intensity in teslas, along with safety protocols like minimum safety distances and mandatory protective equipment. This representation turns a static safety manual into an immersive training experience.
From Invisible Risk to Visual Prevention ⚡
The greatest challenge in physicist safety is the imperceptible nature of many hazards. A radioactive particle or an intense magnetic field cannot be seen or smelled. Scientific visualization breaks this sensory barrier by making the invisible visible. By allowing technicians to virtually navigate a laboratory and see how radiation propagates or how an electric field distorts, a more intuitive and effective prevention culture is fostered, reducing accidents caused by ignorance or fatigue.
How is an invisible radiation or pressure field translated into a three-dimensional risk map that a technician can interpret in real time to prevent a catastrophic accident in a particle physics laboratory?
(PS: modeling manta rays is easy; the hard part is making them not look like floating plastic bags)