Occupational risk analysis in the technical support sector reveals a dual burden: physical and psychosocial. Forced postures in front of the screen and a sedentary lifestyle coexist with the anxiety generated by user support and incident resolution. From visual epidemiology, we can model this data to create three-dimensional simulations that identify critical points of visual fatigue and postural stress.
3D Modeling of Ergonomic and Psychosocial Incidents 🖥️
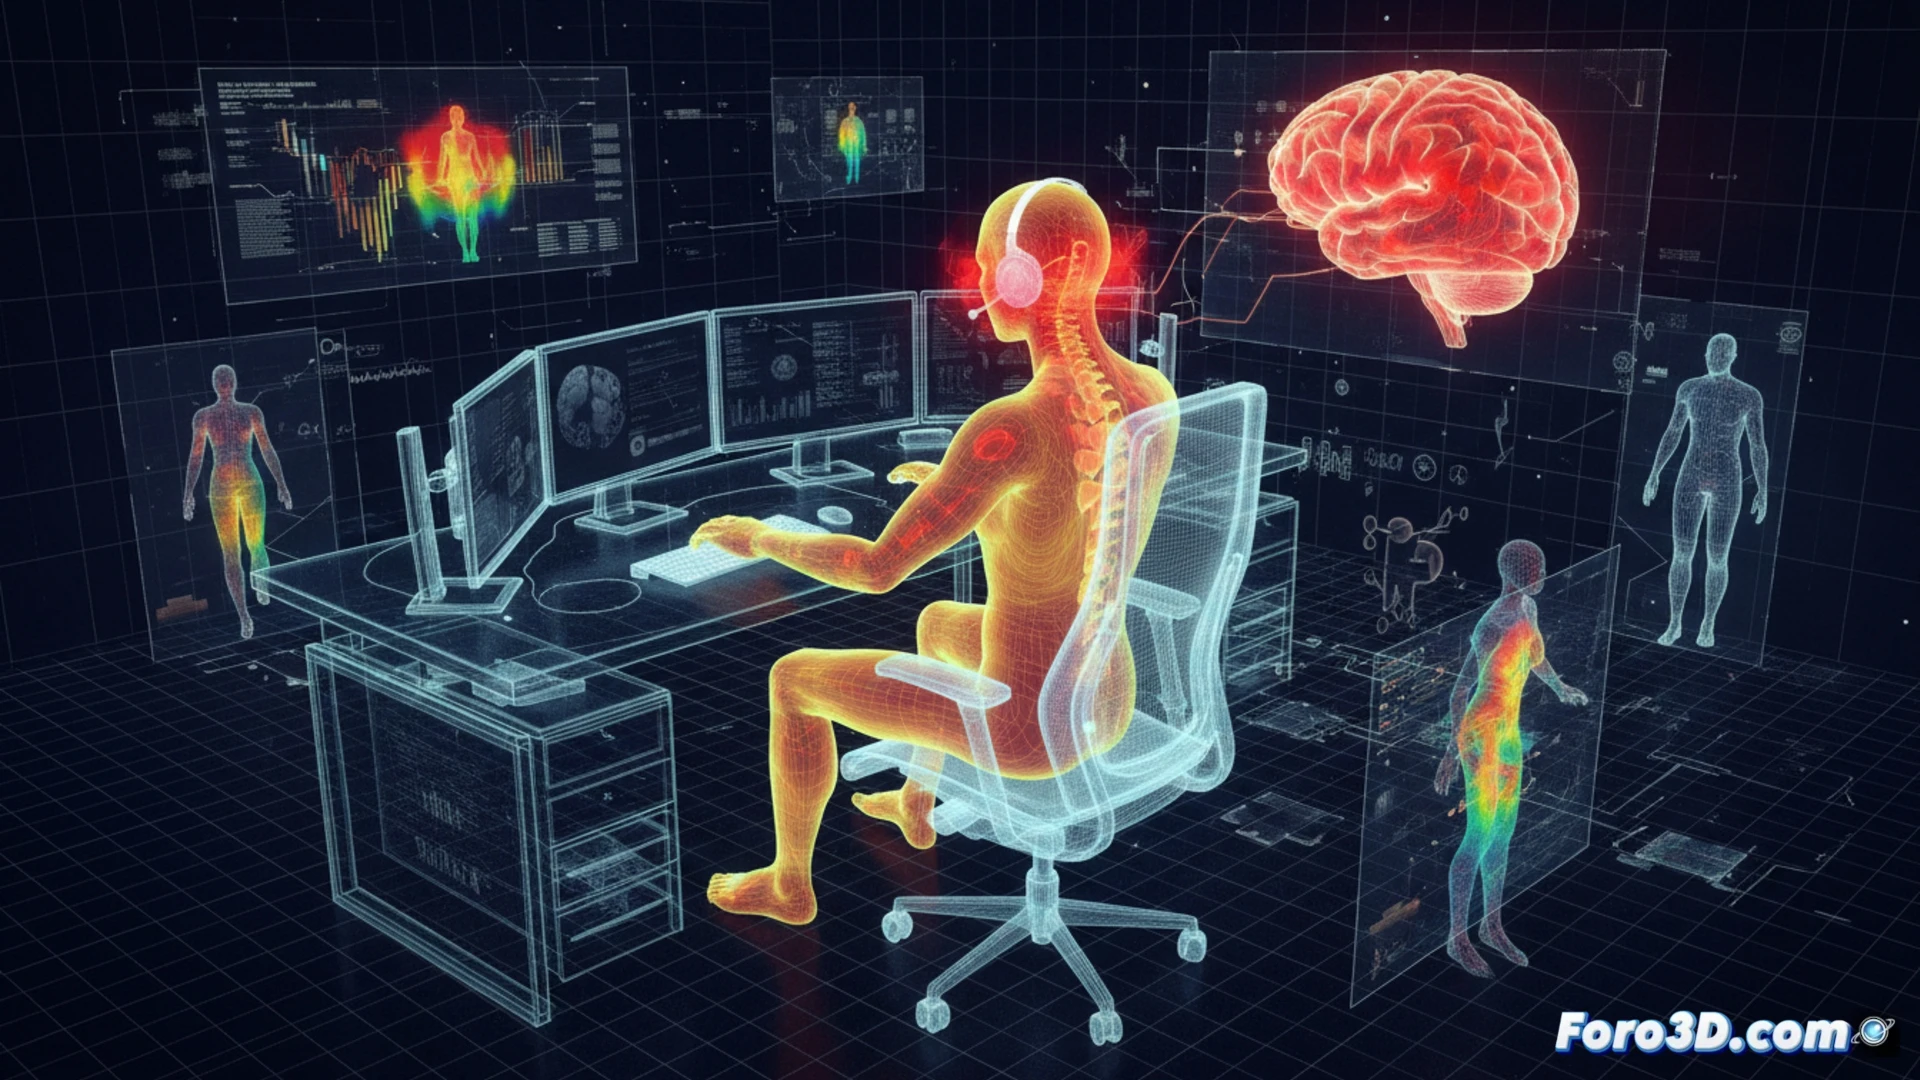
Using heat maps generated with epidemiological data, we can visualize the concentration of musculoskeletal disorders in the cervical and lumbar areas of technicians. Simulations of forced postures, combined with statistics on verbal aggression, allow us to create a digital twin of the workstation. This interactive model shows how visual fatigue accumulates during the workday and how mental tension correlates with incident peaks. The comparison between sectors (telecommunications, software, hardware) shows that the risk of mental overexertion is 30% higher in direct customer service teams.
Visual and Mental Prevention in the Digital Age 👁️
3D technology not only diagnoses but also prevents. By visualizing the accumulated load of stress and anxiety in a volumetric model, occupational health managers can redesign shifts and active breaks. Implementing task rotations and adjusting the lighting of the virtual space reduces the incidence of visual fatigue and verbal aggression. Occupational public health must bet on these interactive tools to humanize the technical support position, protecting their ocular and emotional well-being.
How could 3D heat maps applied to visual epidemiology reveal blind spots in the distribution of postural and psychosocial stress within a technical support team, beyond what traditional ergonomic analyses show?
(PS: modeling health data is like going on a diet: you start with energy and end up giving up)