The profession of a researcher, despite its intellectual profile, harbors a silent rate of occupational hazards that is rarely quantified. Chronic stress from publication deadlines, visual fatigue from screens, and forced postures in the laboratory form a triangle of occupational morbidity. This article proposes an interactive 3D infographic that converts these risks into an epidemiological heat map, allowing visualization of incidence hotspots and modeling of preventive scenarios from the perspective of Public Health and Visual Epidemiology.
3D Modeling of Incidence and Ergonomic Simulation 🔬
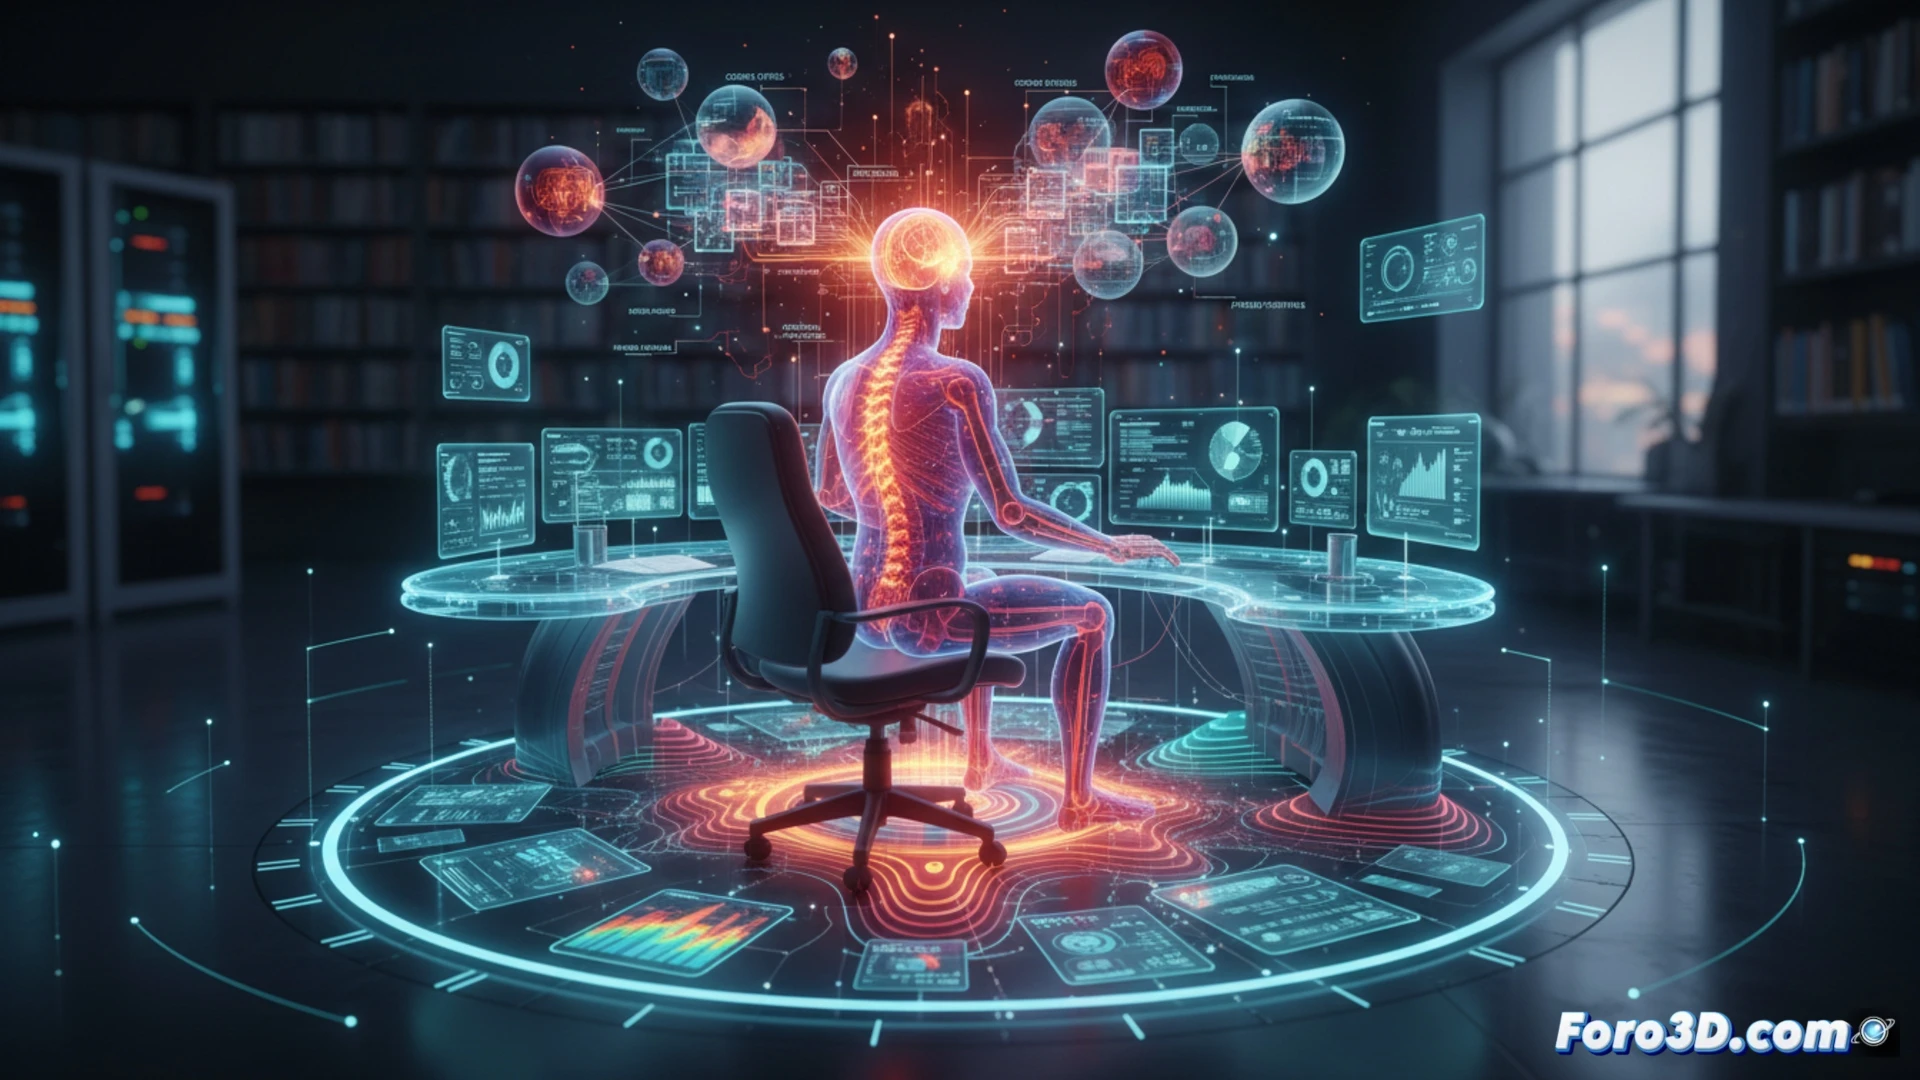
The infographic represents each risk factor as a thermal hotspot in a three-dimensional space. Publication stress is projected as a heat curve that rises in the months leading up to the deadline, with anxiety peaks measured on scales of heart rate and cortisol. Forced postures in the office are simulated using 3D avatars that compare correct cervical alignment against text neck syndrome, while in the laboratory, prolonged standing positions and exposure to chemical or biological agents are modeled, assigning probability and severity values to each area of the space. Statistical incidence data is overlaid as interactive point clouds that the user can explore.
Visualized Prevention: From Data to Habit Change 🖥️
The value of this approach lies in translating mental fatigue and visual strain into quantifiable and spatial indicators. By observing a heat map of their own workday, the researcher identifies the critical points in their routine. The tool also allows activating filters that show correct postures in real-time, offering personalized ergonomic guidance. It is not just about measuring risk, but about making it visible so that prevention ceases to be abstract and becomes an informed and graphical decision.
How can the chronic stress of researchers be translated into a color gradient on an epidemiological heat map that makes visible the highest-risk areas in scientific work environments?
(PS: public health graphs always show curves... just like ours after Christmas)