The cleaning profession, essential for public hygiene, conceals a high burden of invisible morbidity. Accident data reveals that musculoskeletal disorders (MSDs) account for more than 60% of sick leave in the sector, followed by contact dermatitis (15%) and respiratory conditions due to chemical inhalation (10%). Chronic exposure to forced postures and biological agents makes this group a high-risk population for public health.
3D Risk Modeling: Postures, Chemicals, and Aerosols 🧹
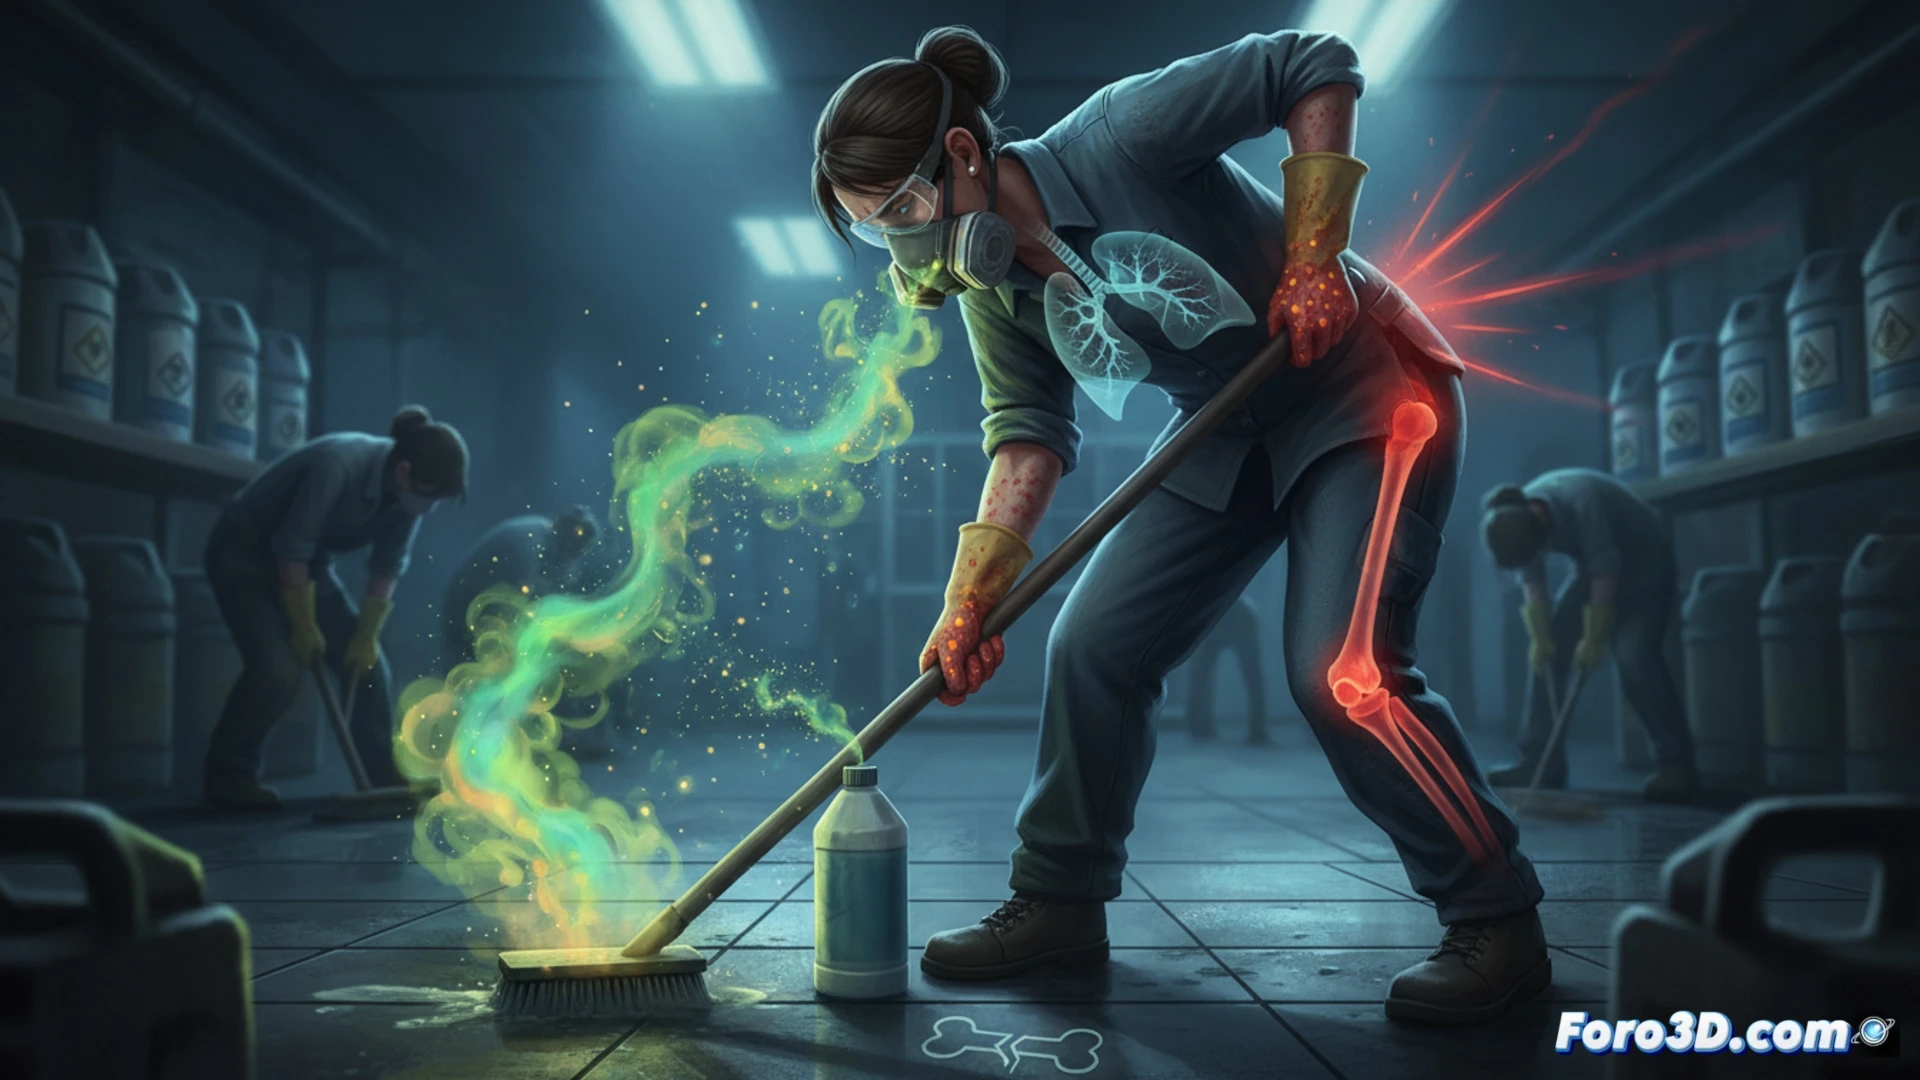
We propose an interactive 3D infographic simulating the cleaner's work environment. The model would visualize heat maps of muscle tension in the lower back and neck during repetitive tasks such as mopping or vacuuming. A second layer would show the dispersion of toxic aerosols (bleach, ammonia) using animated particles, indicating high-concentration zones near freshly cleaned surfaces. Additionally, a dynamic bar chart with statistics on occupational asthma incidence and falls due to wet floors would be included, allowing the user to explore the correlation between exposure time and injury risk.
Visualize to Prevent: The Hidden Cost of Hygiene ⚠️
This tool not only documents the risk but seeks to change the social perception of the profession. By seeing the accumulation of spinal tension or the toxic cloud of a disinfectant, the viewer understands that prevention requires active breaks, ergonomic equipment, and adequate ventilation. Visual epidemiology reminds us that protecting the cleaner is protecting the health of all the spaces they inhabit.
Since cleaning tasks involve exposure to chemicals, forced postures, and repetitive movements, what early visual indicators could be incorporated into epidemiological surveillance to non-invasively detect musculoskeletal or neurological deterioration in workers in this sector.
(PS: public health graphs always show curves... just like ours after Christmas) 😅