The Iran war and the closure of the Strait of Hormuz not only removed 20 million barrels of crude oil per day from the market, sending WTI above $100, but also caused a traffic jam of over 800 vessels and an immediate global energy deficit. Governments responded by accelerating the massive purchase of solar panels, and China, as the main manufacturer, consolidated itself as the world's rescue supplier.
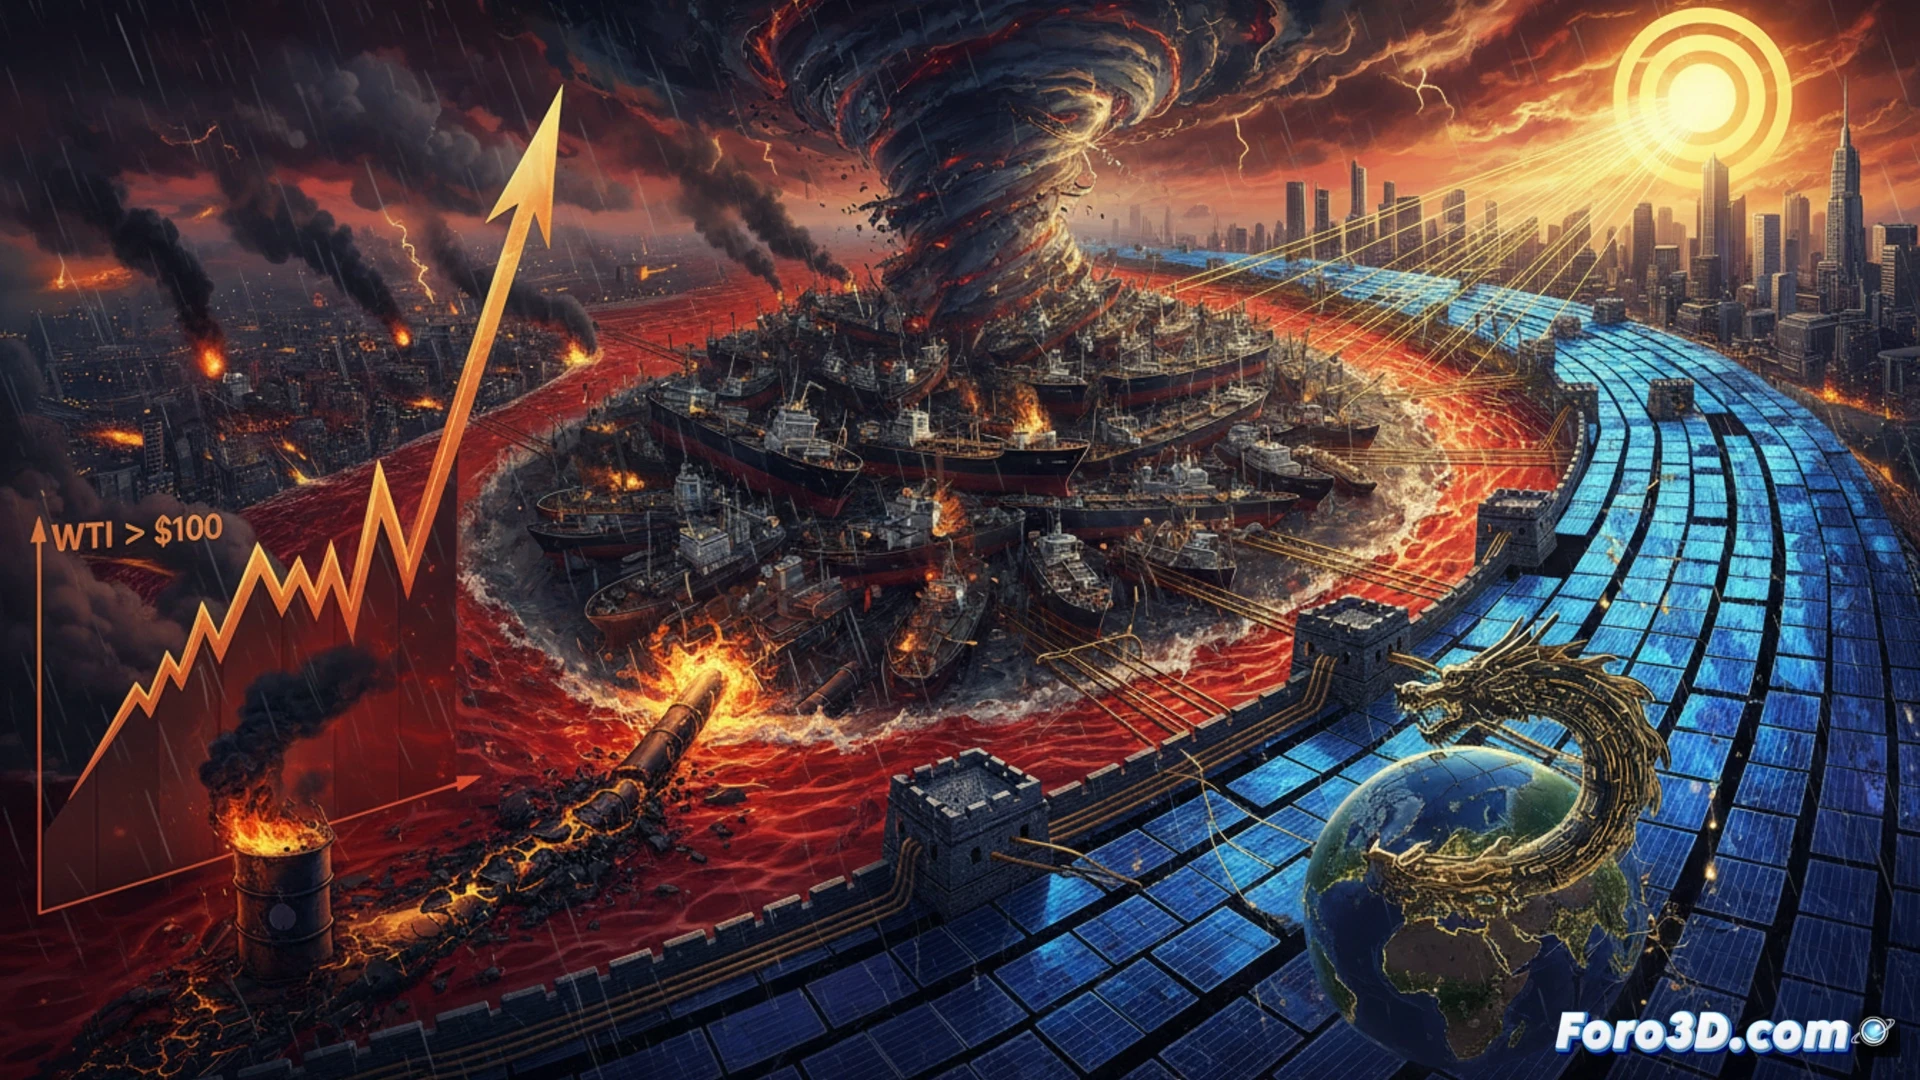
3D modeling of the traffic jam and the new solar flow route 🌍
To visualize this crisis, we can generate a 3D heat map showing the bottleneck in the Strait of Hormuz, with 800 tanker ships stranded within a 50-kilometer radius. Simultaneously, a second flow of dynamic lines must represent the record export of 68 GW of solar panels from the ports of Shanghai and Shenzhen. The destination nodes should highlight demand peaks: a 176% growth in African imports (Nigeria, Kenya, Ethiopia) and a notable increase in India and Malaysia. Europe, Japan, and Australia would appear as dimmer nodes, reflecting their lower dependence on new purchases due to their prior development.
The new dependency: from crude oil to silicon ⚡
This scenario reveals a critical geopolitical reconfiguration. If before energy security depended on control of the Strait of Hormuz, now the new chokepoint is the solar panel supply chain controlled by China. The risk is not mitigated, only shifted. Visualizing these flows in 3D allows analysts to identify vulnerabilities: an excessive dependence on a single supplier for a technology that has become as strategic as oil. The Iran crisis not only accelerated the transition but also defined who holds the keys to the new energy matrix.
How would you simulate the impact of a conflict in one region on global production?