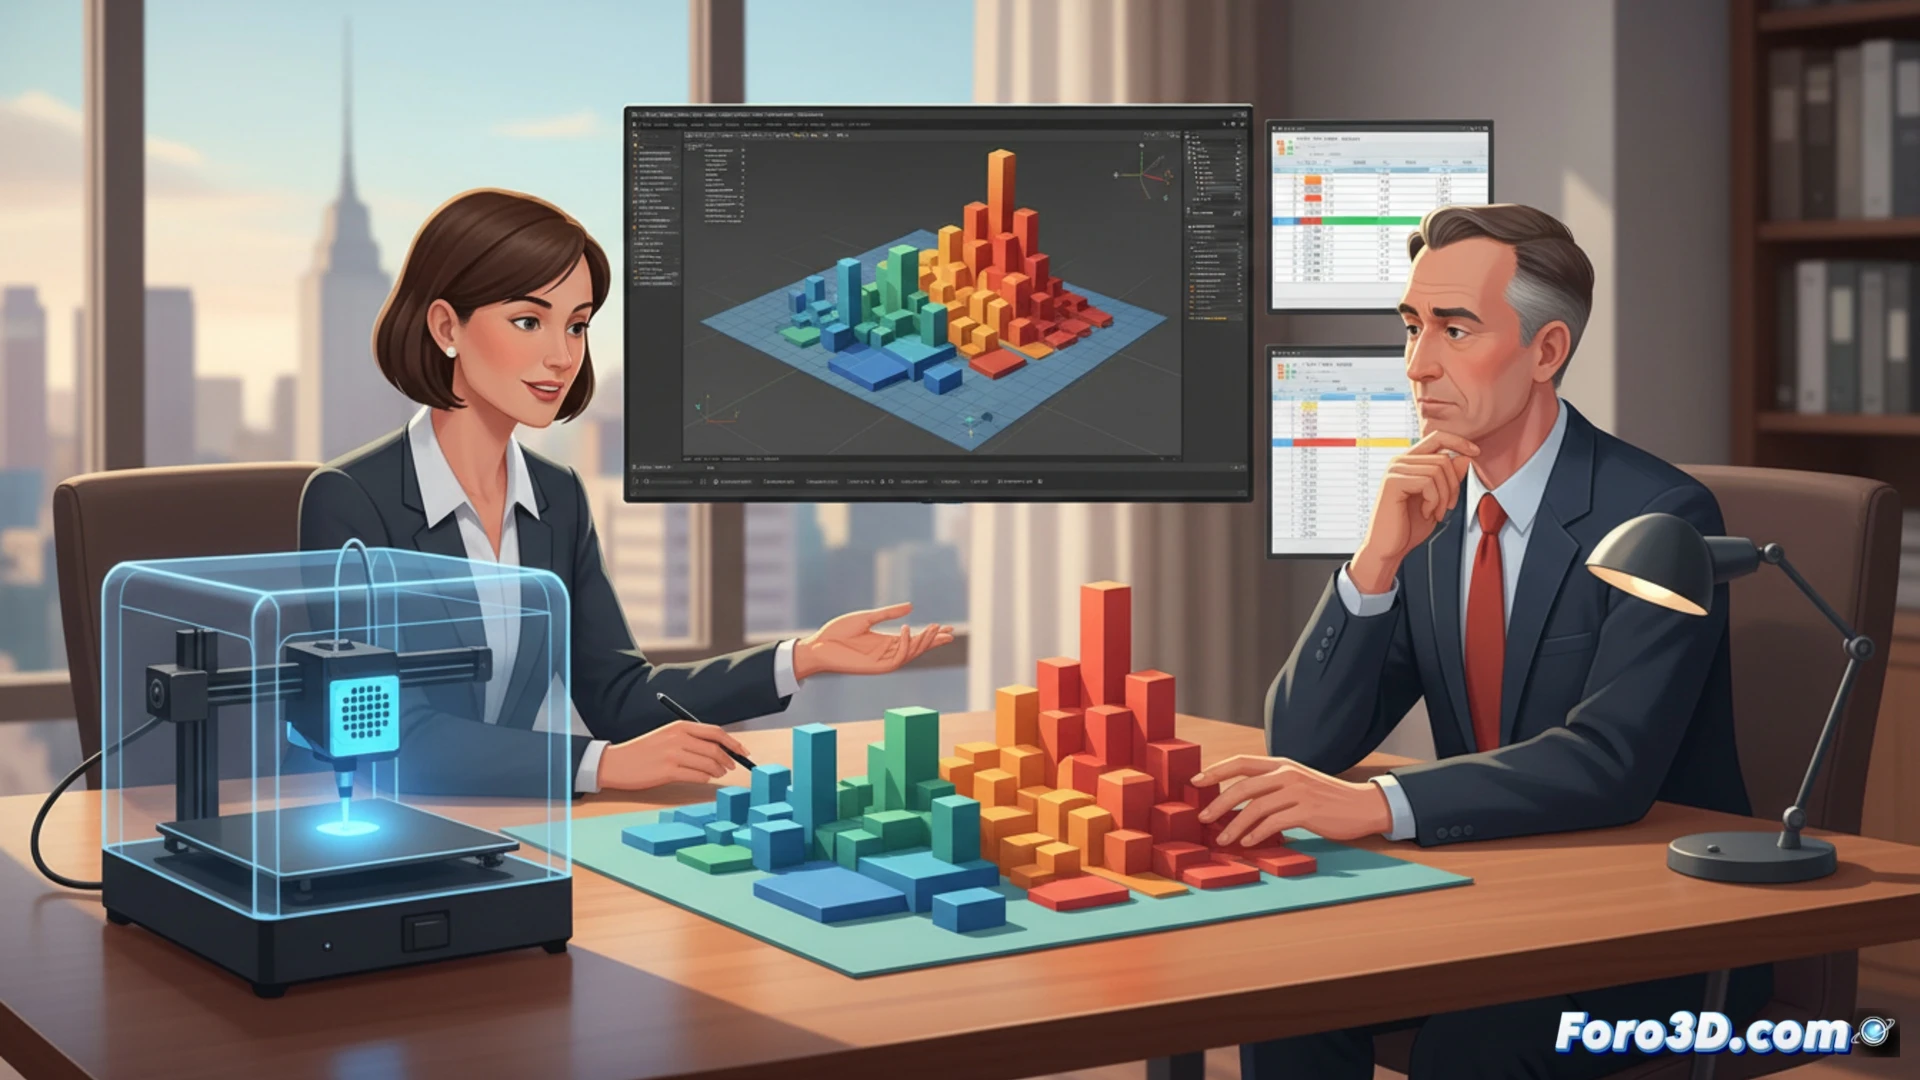
3D technology is not only used for manufacturing plastic parts. A financial advisor can use three-dimensional models to visualize complex investment portfolios. For example, printing a 3D bar chart where the height represents risk and the color represents return, making it easier to explain to clients who don't understand spreadsheets. Programs like Blender or Tinkercad allow you to create these models from Excel data.
Modeling financial data with 3D software 🖥️
The technical process is simple: you export your profitability and volatility data from Excel or Google Sheets to a CSV file. Then, programs like Fusion 360 or MeshLab interpret those values as Z coordinates and RGB colors. You generate a solid that the client can touch and rotate. This eliminates the abstraction of numbers. An investor visualizes their risk as a physical mountain, not as a percentage on a screen. The result: shorter meetings and fewer repetitive questions.
When you print your pension fund and it breaks 💥
The problem comes when you print a junk bond portfolio and the piece crumbles when touched. Perfect metaphor. Or worse: you spend three hours printing an index fund and the printer jams on the IBEX 35 layer. The client looks at you, the piece looks like a melted Rubik's cube, and you say: this is volatility. At least, if the meeting goes badly, you take home a crappy paperweight.