3D technology is not only used to manufacture plastic parts. For a data scientist, it allows visualizing complex models in three dimensions, making it easier to detect patterns that go unnoticed on a flat screen. For example, when analyzing the spatial distribution of sales in a city, a printed model reveals high-density areas that a 2D chart hides.
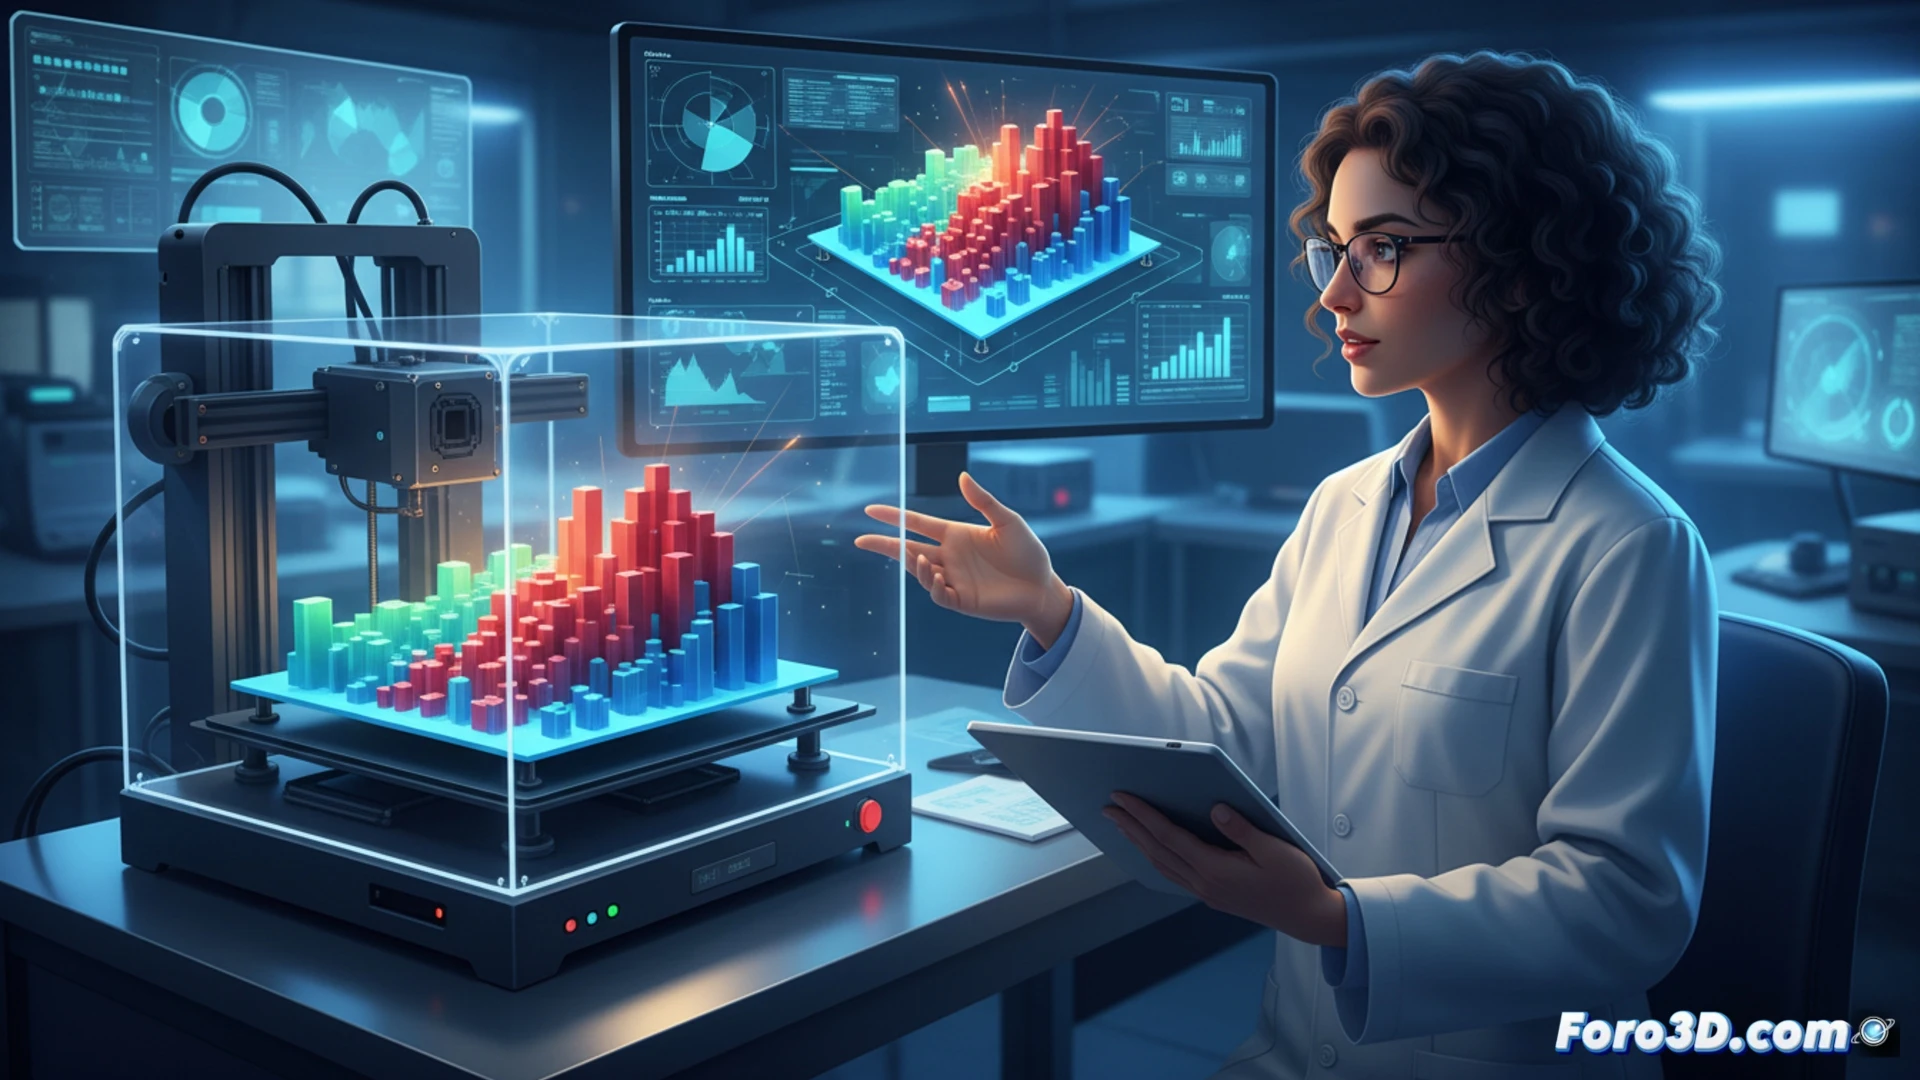
Tactile Data Visualization with Blender and Python 🧊
The workflow begins in Python, where data is processed using libraries like Pandas and NumPy. Then, it is exported to Blender, which converts the variables into 3D meshes. Once the geometry is modeled, slicing software such as Cura or PrusaSlicer is used to generate the G-code. The 3D printer, whether FDM or SLA, materializes the dataset into a physical object. This allows you to hold the correlation between variables in your hand, something a scatter plot does not offer.
The Day Your Boss Asks You for a Model of the Database 🖨️
Now imagine your boss walks in and asks you: I need to touch the data. You hand them a sphere full of spikes representing the standard deviation of the quarter's sales. The look on their face when they don't know where to grab it is the same as when you explain what a neural network is. But careful, if the print fails and the sphere comes out deformed, you tell them it's a polynomial regression model. No one argues with printed parts.