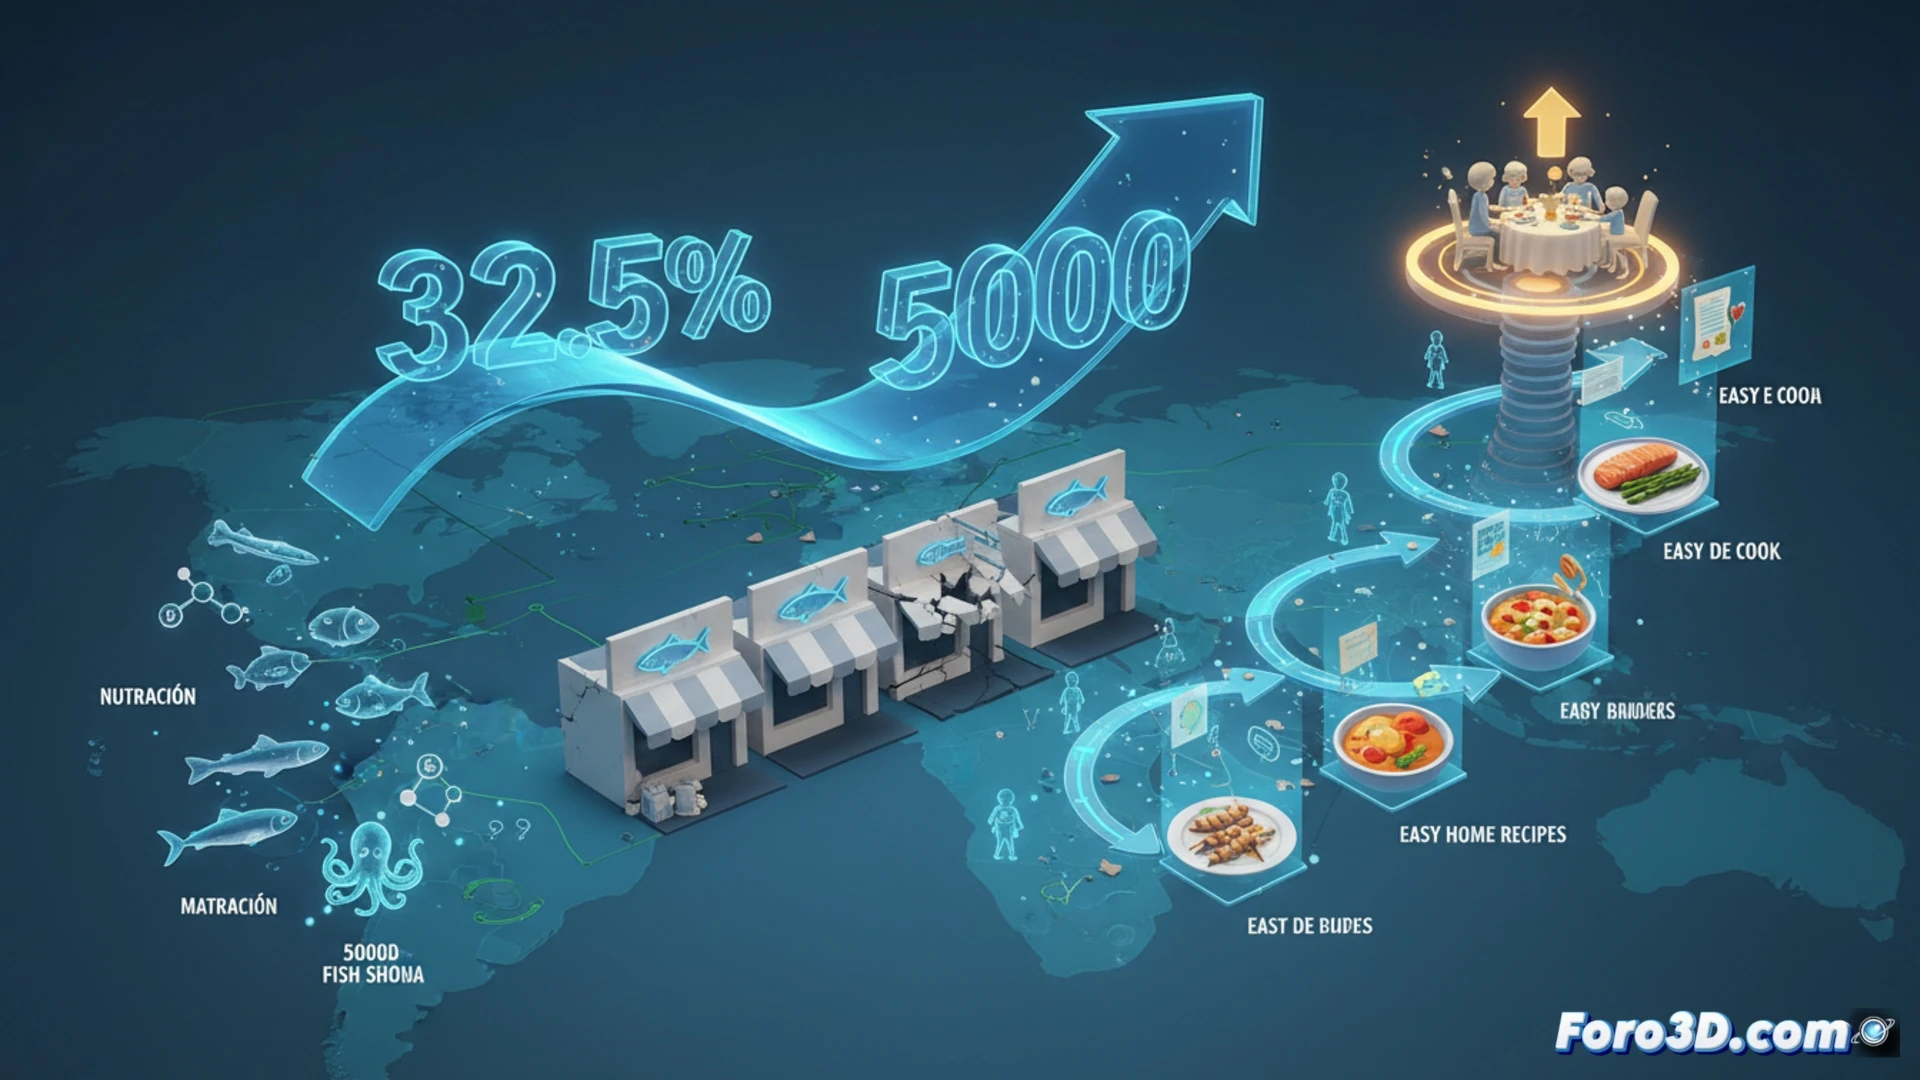
Fish consumption in Spanish households has suffered a historic collapse of 32.5% in the last decade, dropping from 26.4 kilos per person in 2014 to just 17.8 kilos by the end of 2025. This decline has led to the closure of 5,000 fishmongers since 2007, representing the loss of a third of these businesses and a reduction in employees from 26,237 to 18,396. Data from the Ministry of Agriculture confirms that purchase intensity continues to weaken, while fresh fish declines by 5.6% and frozen fish rises by 1.5% in 2025.
3D data visualization: consumption evolution and nutritional comparison 🐟
To address this crisis through food education, we propose an interactive 3D infographic that allows visualizing the consumption decline between 2014 and 2025 using animated three-dimensional bar charts. The model should include a detailed nutritional comparison between fresh and frozen fish, highlighting that frozen fish retains up to 90% of nutrients if processed correctly. Additionally, 3D models of butchered fish can be integrated, showing cuts such as fillets, belly flaps, and bones, along with cooking simulations that educate on optimal times and temperatures to preserve proteins and Omega-3 fatty acids.
From restaurant to home kitchen: 3D recipes to revive the habit 🍳
Fish is increasingly associated with leisure and less with home cooking, as evidenced by the rise of sushi, sashimi, poké bowls, and ceviche in restaurants, while people avoid preparing it at home due to laziness or perceived cost. The 3D infographic can include quick recipes modeled in three dimensions, such as a 15-minute baked salmon or a step-by-step homemade ceviche, with cutting and plating simulations. By visualizing the process and nutritional value, the goal is to educate consumers and encourage the purchase of frozen fish as an accessible and healthy alternative, thus reversing the negative trend in the sector.
How can an interactive 3D infographic modify purchasing habits and food education to curb the collapse of fish consumption in Spain?
(PS: at Foro3D our diet is based on pixels and coffee, but at least we render vegetables)