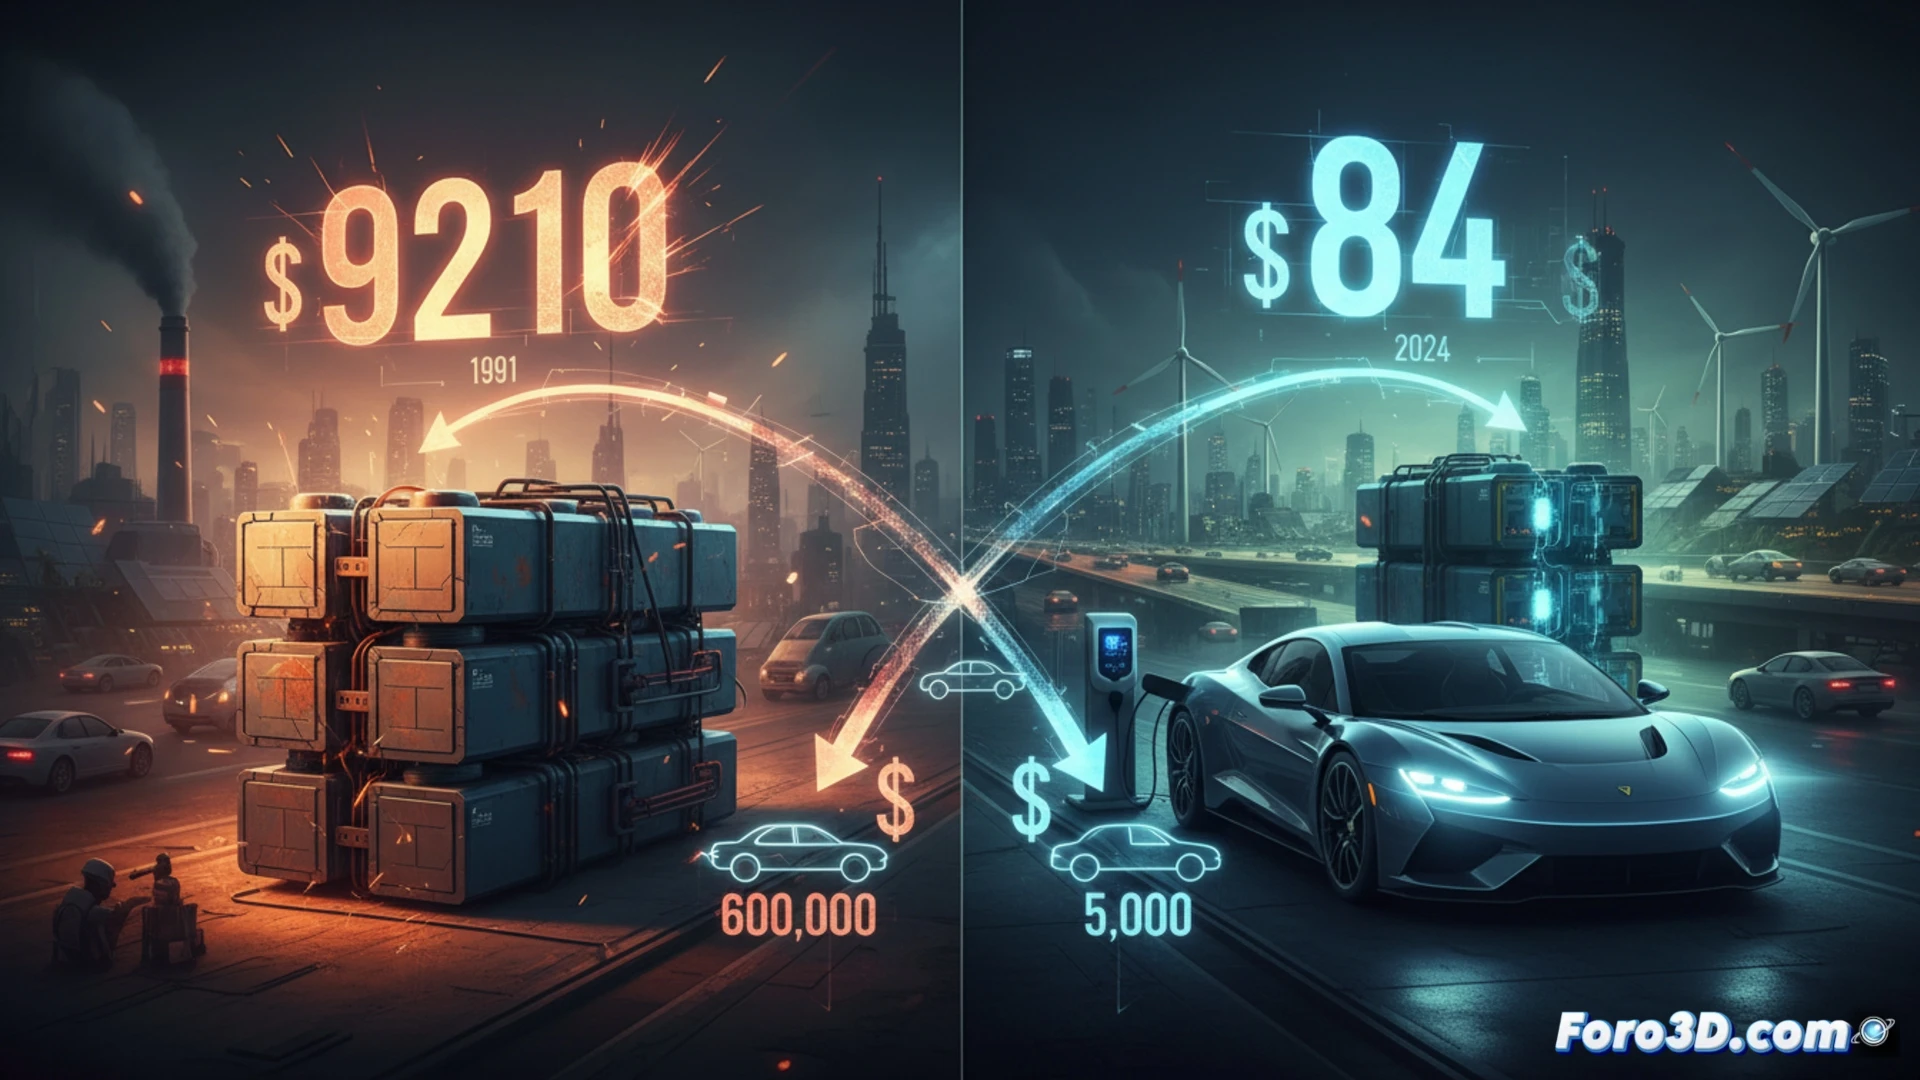
In the last 35 years, the price of lithium batteries has experienced a historic 99% drop, a milestone that redefines the economic viability of the energy transition and electric mobility. According to data from Our World in Data and BloombergNEF, in 1991 the cost per kWh reached $9,210 (adjusted to 2024), while in 2023 it fell to just $111. This massive cost reduction has transformed the automotive industry: the battery of an electric car with 350-400 km of range, which cost around $600,000 in 1991 and over $20,000 a decade ago, now stands at about $5,000.
Data analysis: logarithmic scales and cumulative production 📊
The graphical representation of this evolution reveals a constant trend that defies expectations of stabilization. The first chart, with a logarithmic scale on the vertical axis, shows a continuous decline from 1991 to reach $50-60/kWh in 2024, with no signs of a plateau. The second chart relates price to cumulative battery production, which went from 130 kWh in 1991 to 3,510 GWh in 2023. The straight line over decades confirms a direct correlation: each doubling of production reduces cost by a fixed percentage, following a classic industrial learning curve. This pattern suggests that the $100/kWh threshold, considered the point of parity with internal combustion vehicles, was already surpassed at the end of 2023 with a record of $84/kWh.
Implications for 3D visualization of industrial data 🚀
Representing this dynamic in an interactive 3D infographic offers a unique perspective for economic analysis. I propose creating a model with three-dimensional bars showing the cost per kWh year after year, where each bar is accompanied by a 3D model of an electric car battery whose size scales proportionally to its historical price. Additionally, a 3D bubble chart relating price to cumulative production would allow the user to rotate the scene and visually explore how exponential production growth has compressed costs. This tool not only illustrates the 99% drop but also allows identifying inflection points and projecting future declines, vital for planning investments in electrification.
Considering the 99% drop in lithium battery prices, how is this cost reduction transforming the economic viability of large-scale 3D printing in sectors such as additive manufacturing of electric vehicles or energy storage for 3D rendering server farms?
(PS: 3D financial dashboards are like sales: everything looks more attractive than it really is)