3D technology can transform a stockbroker's work by enabling them to visualize complex financial data in three-dimensional models. Instead of looking at flat screens with candlestick charts, a broker can physically manipulate a 3D representation of market volatility, identifying buying and selling patterns more quickly. This helps in making informed decisions without relying solely on numerical tables.
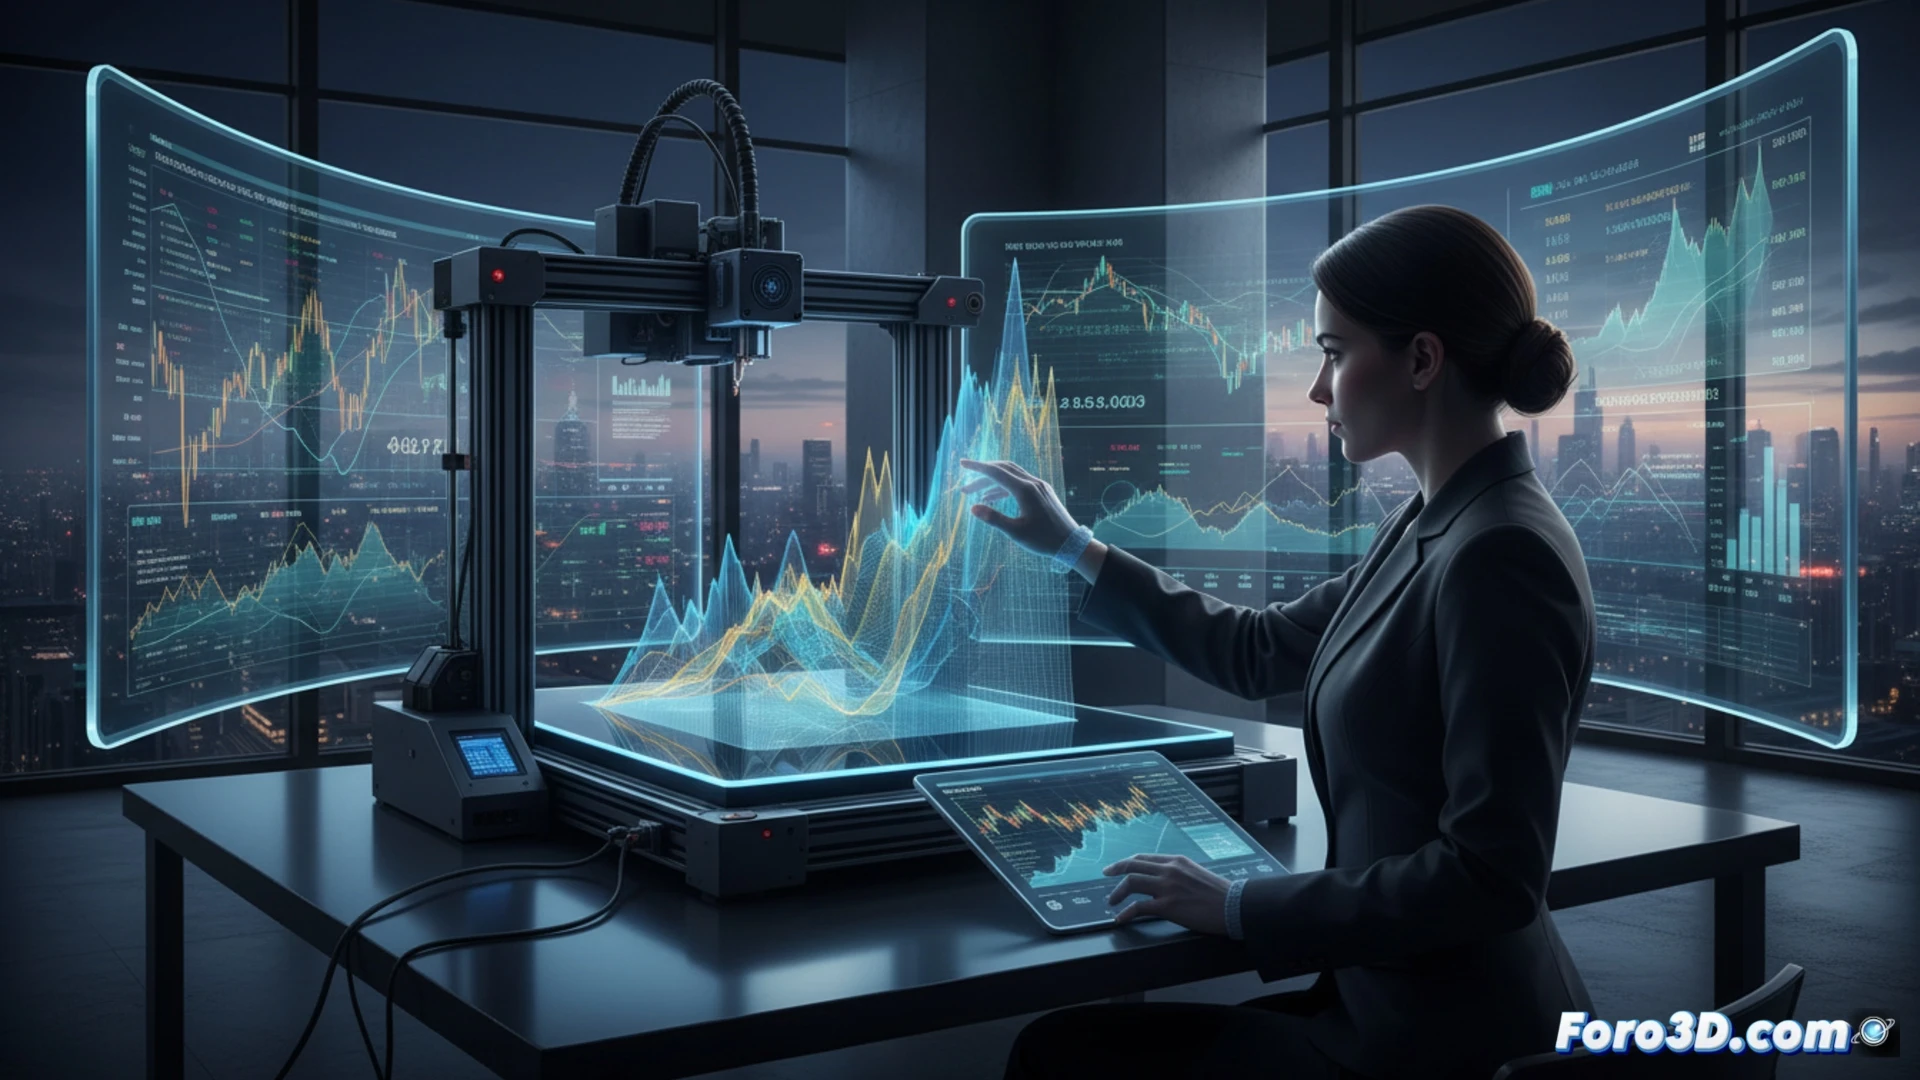
3D Modeling and Real-Time Portfolio Simulation 🚀
To implement this, modeling software like Blender or Fusion 360 is needed to create asset representations, along with trading platforms with open APIs such as MetaTrader or Interactive Brokers. Using Python with libraries like Matplotlib 3D or Plotly, the broker can convert S&P 500 data into geometric shapes that change color or size based on performance. A practical example: a sphere that expands and turns red when a stock drops by 5%, visually alerting the trader without looking at numbers.
When Your Desktop Cube Tells You to Sell 🤖
Imagine having a 3D-printed model of your stock portfolio on the table. It sounds futuristic, but the reality is that many brokers still rely more on their intuition and a strong cup of coffee than on a blinking plastic cube. The problem is that if the 3D printer jams just as the market plummets, you'll end up busier cleaning melted filament than saving your investments. In the end, technology helps, but it doesn't replace the instinct of knowing when to turn off the machine and look at the screen.