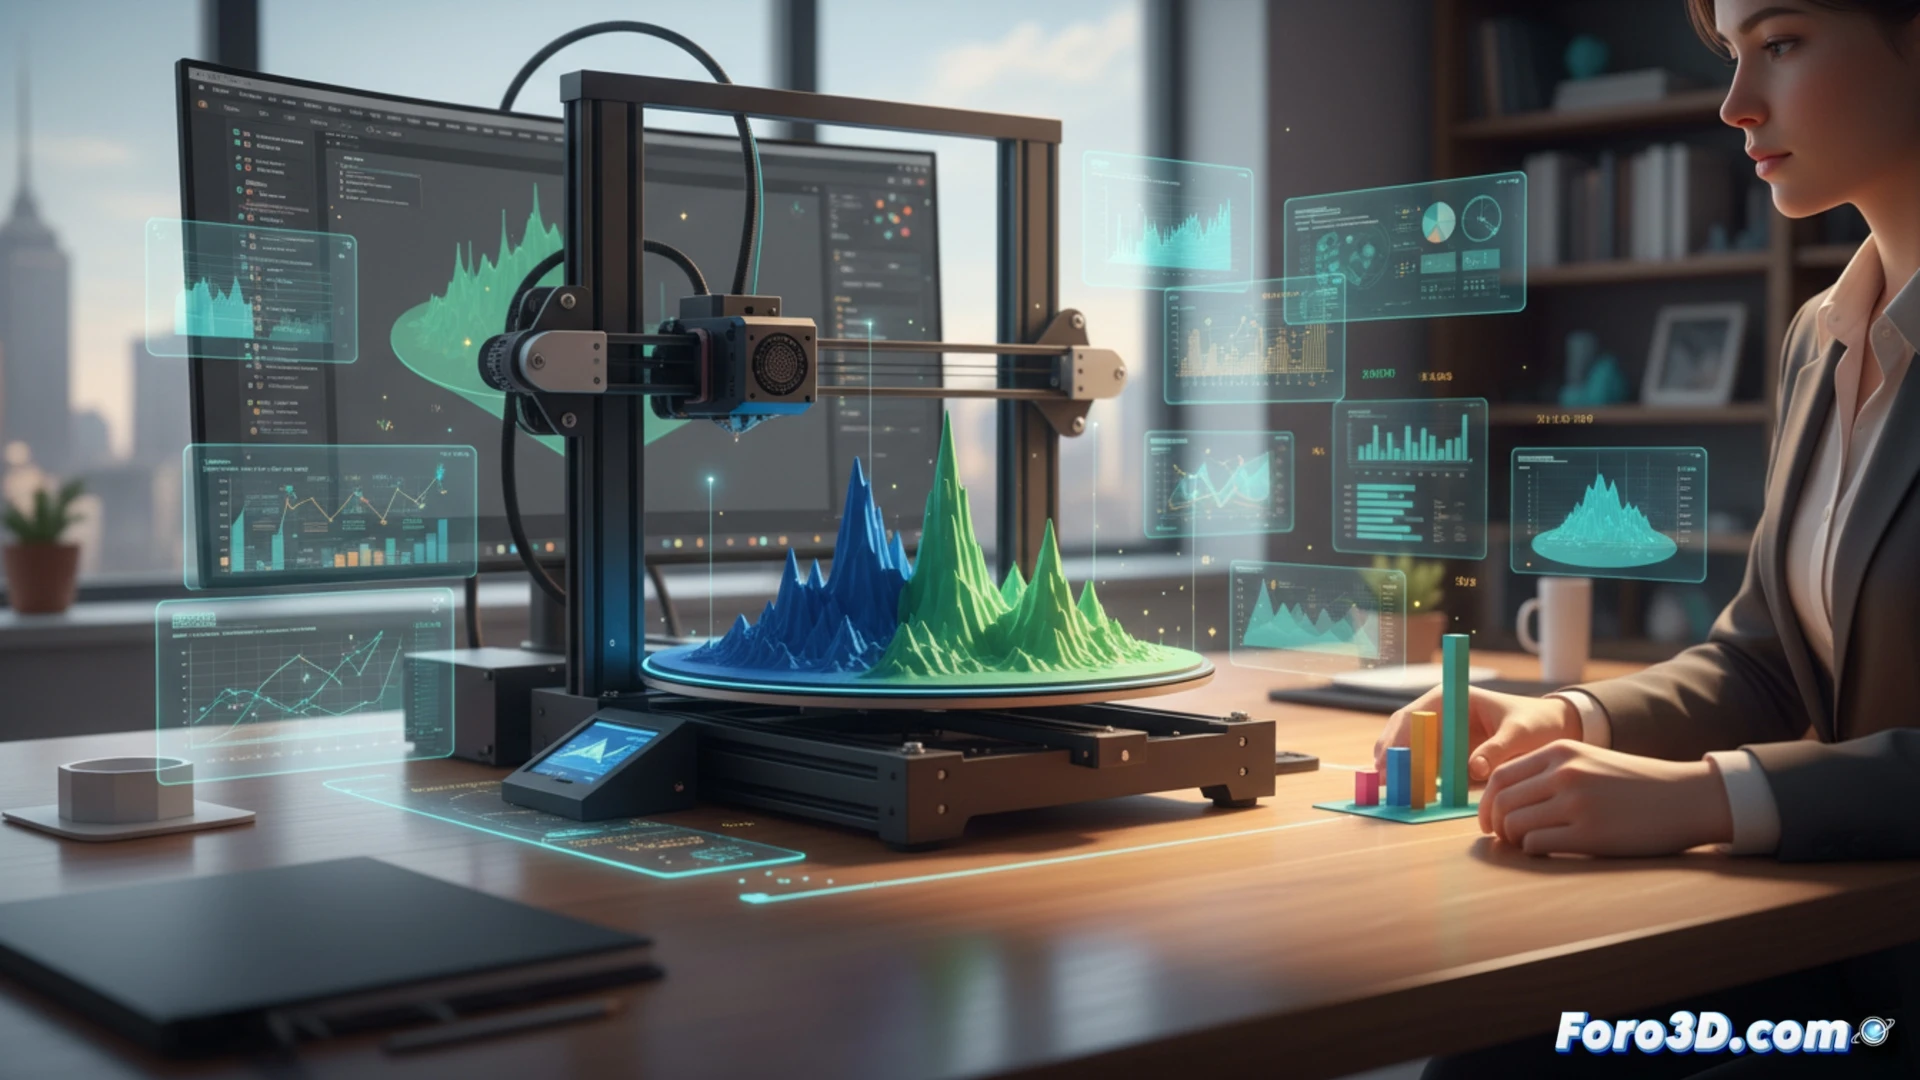
Economists work with abstract models and mountains of data. 3D technology allows transforming those numbers into physical objects. For example, a topographical map of regional GDP printed in 3D clearly shows economic inequalities. You need an FDM printer, PLA filament, and modeling software.
Tools for modeling economic indicators in 3D 🛠️
The process starts in Excel or R Studio to calculate variables. Then Blender or Fusion 360 is used to convert tables into volume. A Python script can read inflation data and generate a 3D mesh where the height represents the CPI. The Ender 3 or Prusa i3 printer transforms the STL file into a physical object. This facilitates presentations at central bank meetings or university classes.
Macroeconomics for dummies with plastic figures 📊
Now instead of falling asleep at a conference on price elasticity, you can run your fingers over a supply curve printed in PLA. If your boss doesn't understand the Phillips curve, you toss him a 10 cm polygon. The plus is that if the meeting gets tense, you can use the GDP sculpture to gently tap the table. Of course, don't print the external debt at real scale because it won't fit in your office.