The International Space Station (ISS) faces a constant threat from micrometeoroids and orbital debris. To analyze these events, engineers combine Siemens Simcenter, Blender, and Volume Graphics in a technical workflow that allows reconstructing impact trajectories and evaluating the deformation of the Whipple shield. This article breaks down how scientific visualization transforms simulation data into critical information for orbital safety.
Trajectory Reconstruction and Whipple Shield Deformation 🛰️
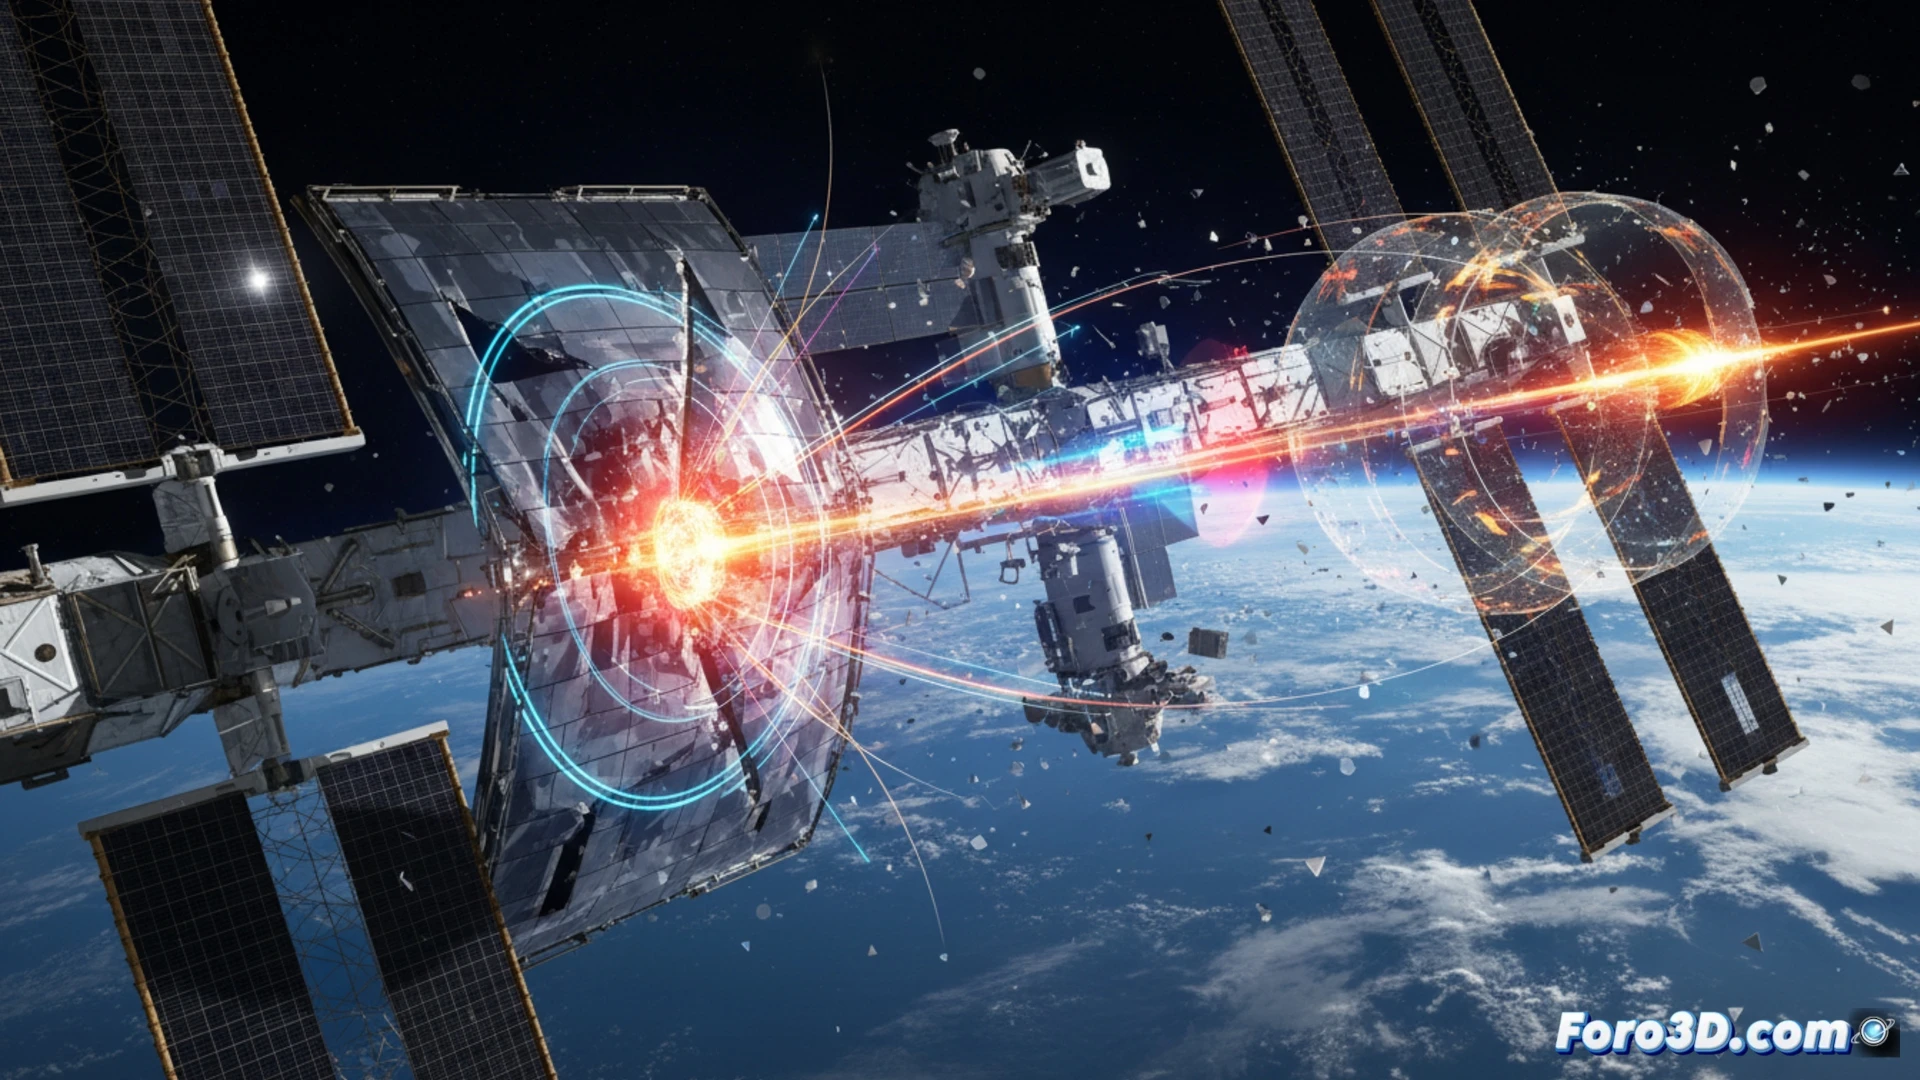
The process begins in Siemens Simcenter, where the impact dynamics of high-velocity particles against the ISS Whipple shield are modeled. This software calculates projectile fragmentation and shock wave propagation under vacuum and microgravity conditions. Deformation data and residual trajectories are exported to Volume Graphics for volumetric analysis via virtual micro-CT, allowing inspection of internal damage to the structure. Finally, Blender takes these results and converts them into photorealistic 3D animations, facilitating the visual interpretation of the impact sequence and the evolution of the crack in the metal.
Orbital Safety Through 3D Data Synthesis 🔬
The true innovation lies in the integration of these three programs. While Simcenter provides physical rigor and Volume Graphics offers tomographic precision, Blender bridges the communication gap. This case study demonstrates that scientific visualization is not mere ornamentation, but an engineering tool for validating shield models and optimizing repair protocols on the ISS. In the era of space exploration, seeing is believing is also seeing to prevent.
How can the trajectory and impact of a micrometeoroid on the ISS structure be modeled and visualized in real time to predict damage and optimize repairs?
(PS: if your manta ray animation doesn't excite, you can always add documentary music from channel 2)