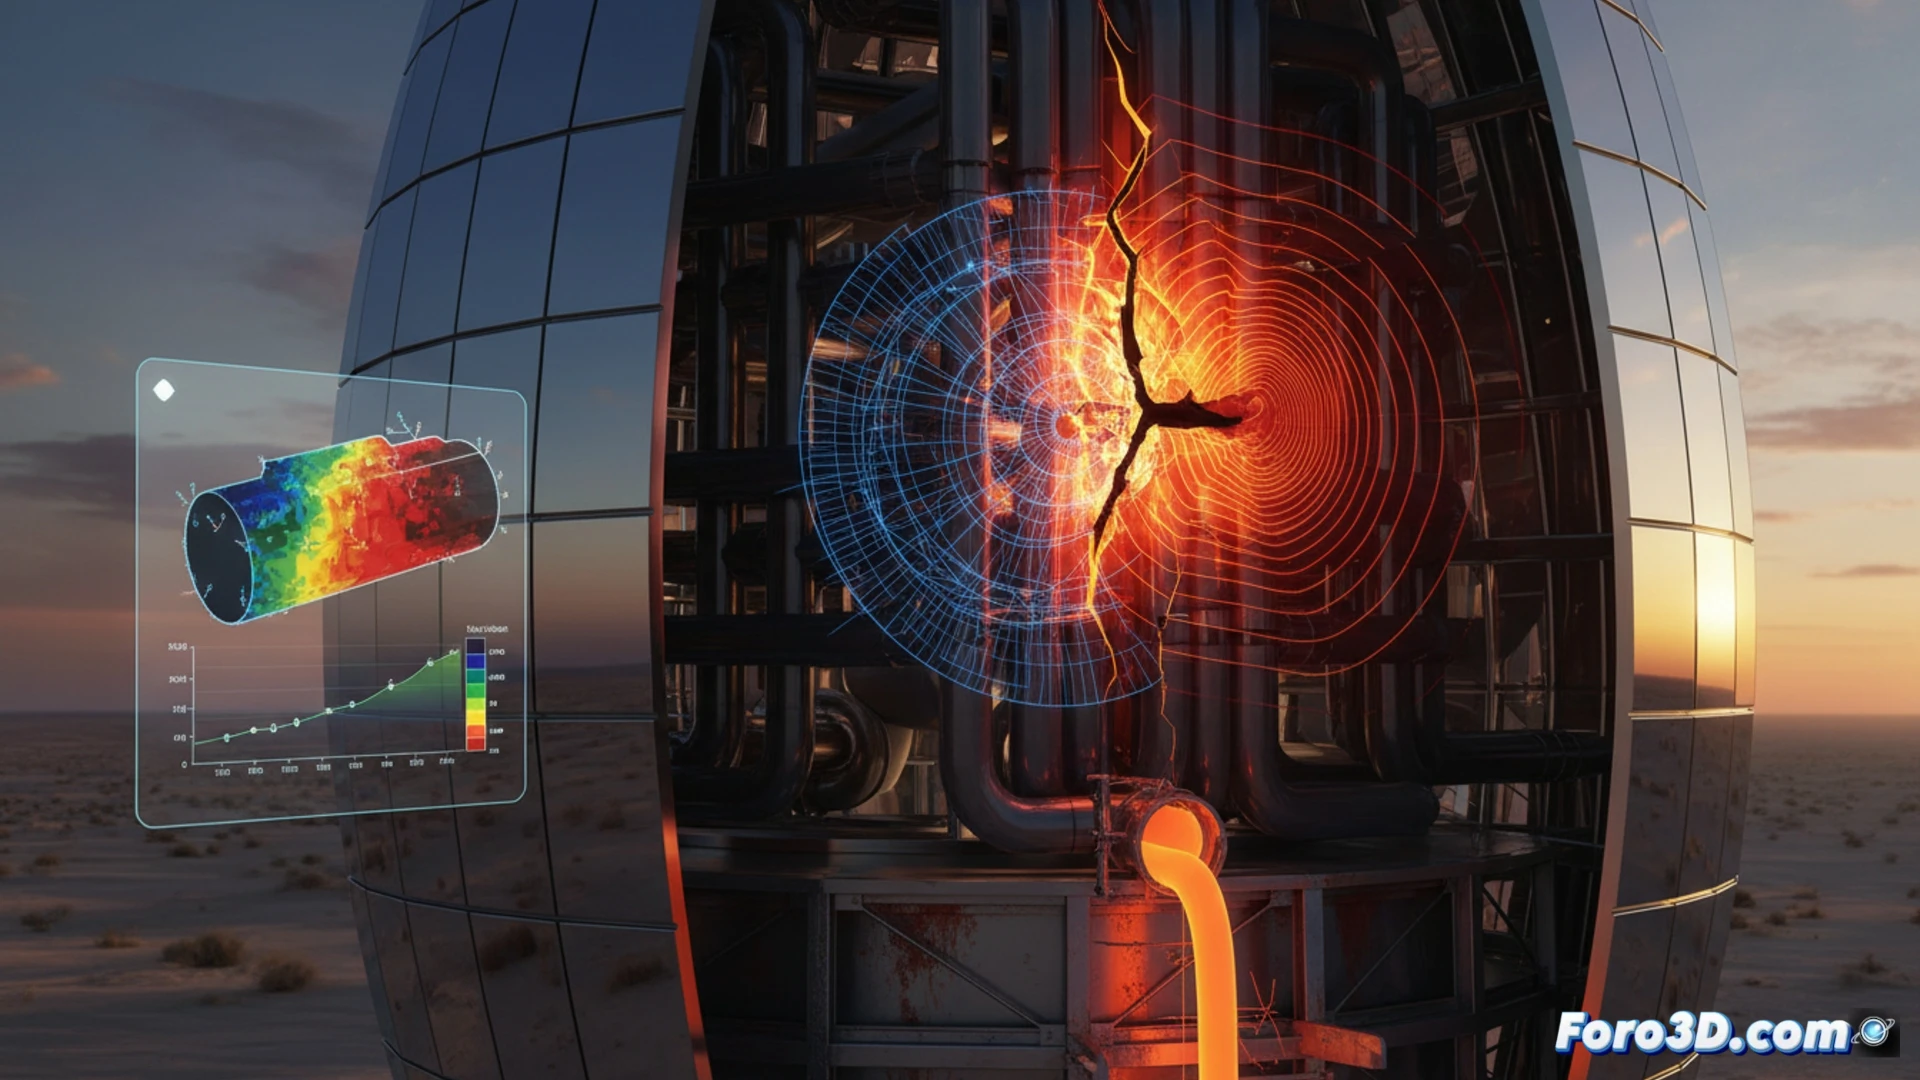
The central receiver of a concentrated solar power tower suffered a critical fracture, causing molten salt to spill onto the structure. The failure, originating from an extreme thermal gradient in the alloy pipes, required precise analysis. A workflow combining laser scanning with infrared thermography was implemented to capture the actual geometry and surface temperatures, allowing the exact crack initiation point on the 3D pipeline to be identified.
Data Capture and Thermal Gradient Simulation 🔥
The process began with LiDAR scanning using Leica Cyclone, generating a high-density point cloud that reflected the post-fracture deformation. Simultaneously, infrared thermography recorded the isotherms on the metal surface, creating a heat map of the gradient. This data was merged in Ansys Mechanical, where the actual thermal boundary conditions were applied. The finite element simulation reproduced the differential expansion and contraction cycle, locating the zone of maximum stress concentration. Fatigue analysis revealed that the microcrack originated at a weld where the coefficient of expansion generated a cyclic stress peak, exactly matching the observed physical break.
Predictive Visualization for Failure Prevention 🛠️
The simulation results were integrated into Autodesk Revit to document the plant's digital twin, labeling the critical zones of the alloy pipe. Finally, Twinmotion was used to generate an immersive visualization of the event, showing the evolution of the thermal gradient and the progression of the fracture. This interactive model not only explains the failure that occurred but also serves as a predictive tool to redesign supports and insulation, mitigating the risk of future incidents due to thermal stress in solar infrastructure.
What 3D mapping and thermal fatigue simulation methodology do you recommend for predicting the lifespan of the receiver in a solar tower against molten salt fracture?
(PS: Material fatigue is like yours after 10 hours of simulation.)