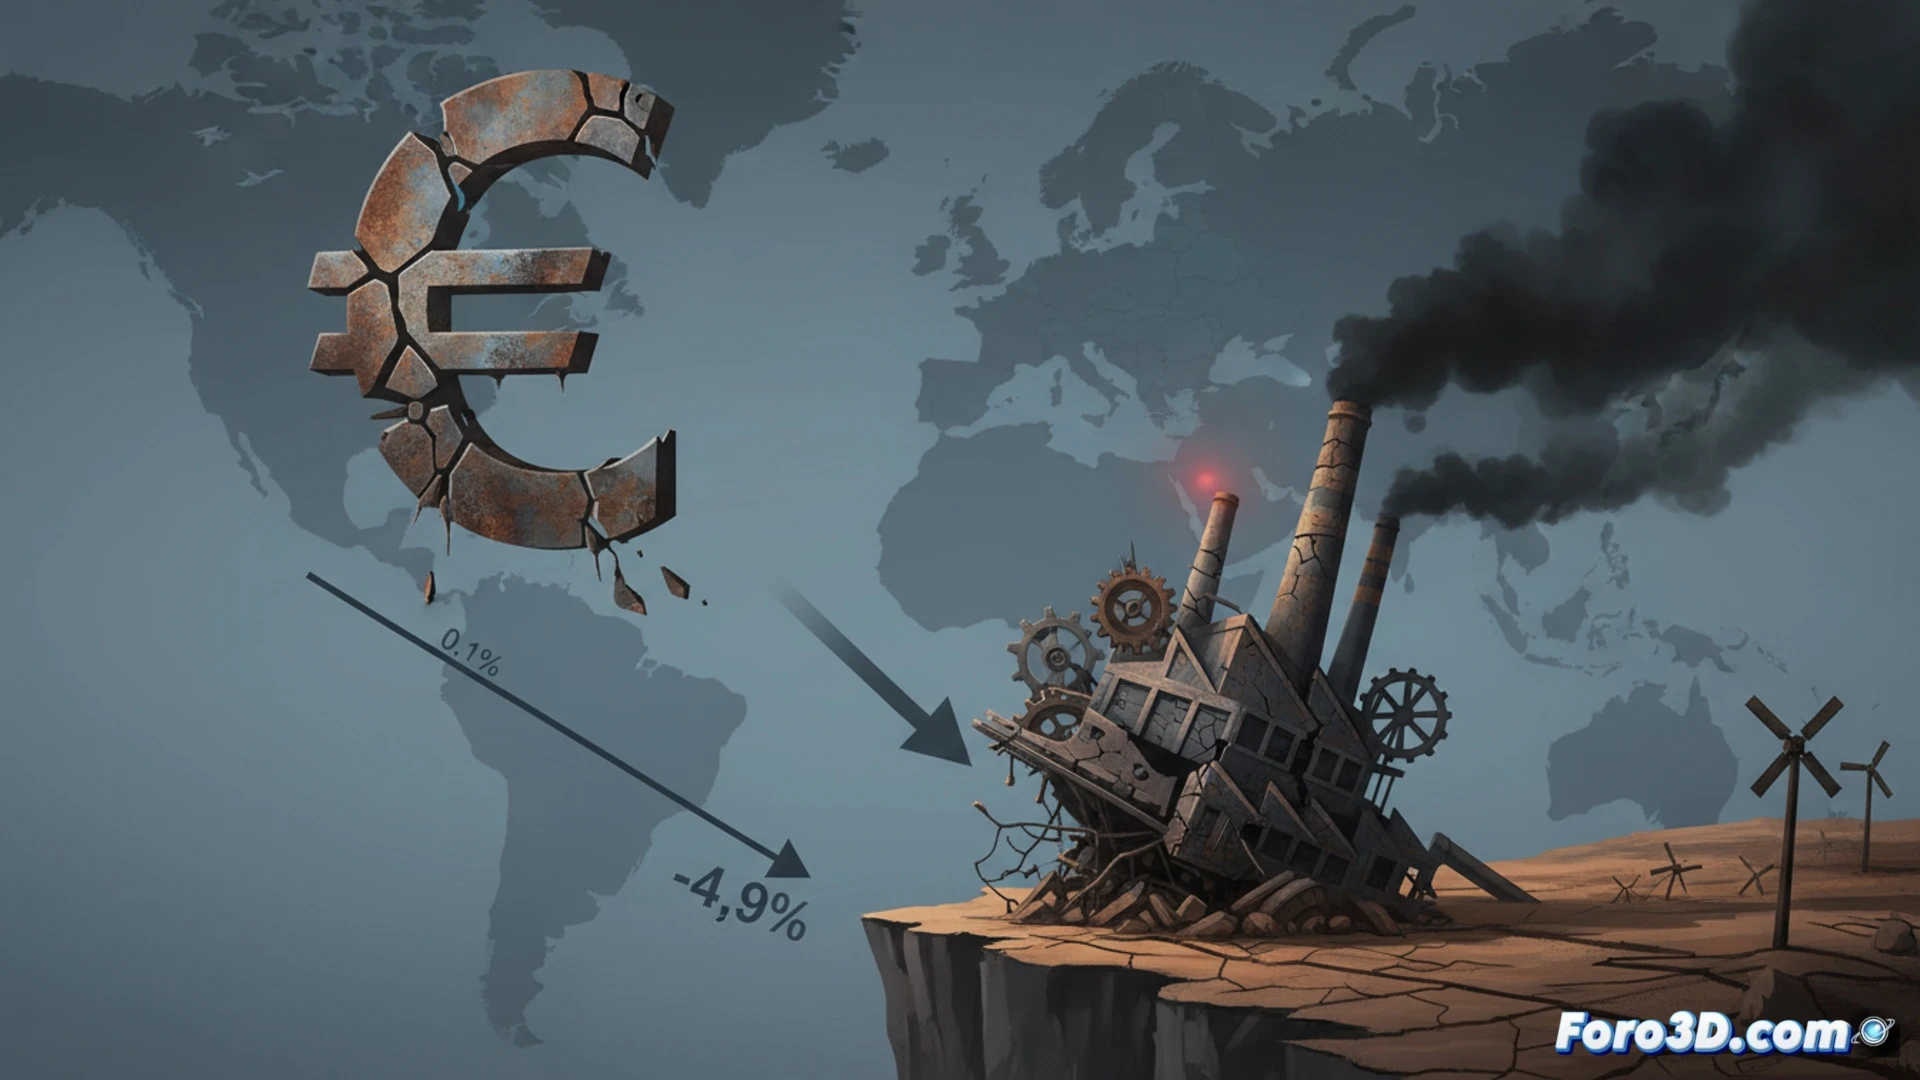
The first quarter of the year leaves a bittersweet picture for the European economy. While the European Union as a whole achieves a modest advance of 0.2%, the eurozone remains at a worrying 0.1%, teetering on the brink of technical stagnation. This slowdown, driven by persistent inflation and weak domestic demand, contrasts with the resilience of non-euro countries. In Spain, the outlook is even more uneven: national industrial production rises by 2.1%, but Castilla-La Mancha suffers a 4.9% slump in March, highlighting serious problems in its local productive fabric.
3D Visualization: Growth comparison and industrial heat map 📊
To capture this economic duality, we propose an interactive dual-panel 3D infographic. The first element would be an animated three-dimensional bar chart comparing eurozone GDP growth (0.1%) against that of the EU (0.2%). The bars, in contrasting colors (cold blue for the eurozone, warm green for the EU), would rise slowly from a flat base, allowing the user to appreciate the minimal difference between the two blocs. The second panel would consist of a 3D map of Spain with smooth topographic relief. Overlaid on this map would be a thermal color gradient: an intense red focus over Castilla-La Mancha would indicate the 4.9% drop, while the rest of the country would be shaded in green and blue tones to reflect the national increase of 2.1%. Each region would have a pop-up tooltip that, on hover, details the exact figure and possible causes, such as the weakness of the agri-industrial sector or the contraction of external demand in the La Mancha region.
The reflection of two speeds on the same board 🧩
This visualization not only shows figures but reveals the growing fragmentation of the European economic space. The paralysis of the eurozone suggests that countries with a single currency share common burdens, such as a restrictive monetary policy that penalizes investment. On the other hand, the contrast in Spain indicates that macro policies fail to homogenize regional development. The 3D infographic thus becomes a diagnostic tool: it allows identifying that the national recovery does not permeate certain territories, pointing to the need for specific interventions to correct structural imbalances in the industrial sector.
How does the industrial slump in Castilla-La Mancha affect the supply chain of parts and materials for 3D printer manufacturers in the Eurozone?
(PS: simulating economic scenarios is like betting on football pools: the house always wins)