An international team of astronomers has presented the largest and most detailed three-dimensional map of the cosmos, created from data from the Dark Energy Spectroscopic Instrument (DESI). This massive cartography, encompassing millions of galaxies and quasars, not only redefines our understanding of the universe's structure but also offers crucial clues about the mysterious dark energy driving its accelerated expansion.
Spectroscopy and Redshift: The Engineering Behind the Map 🌌
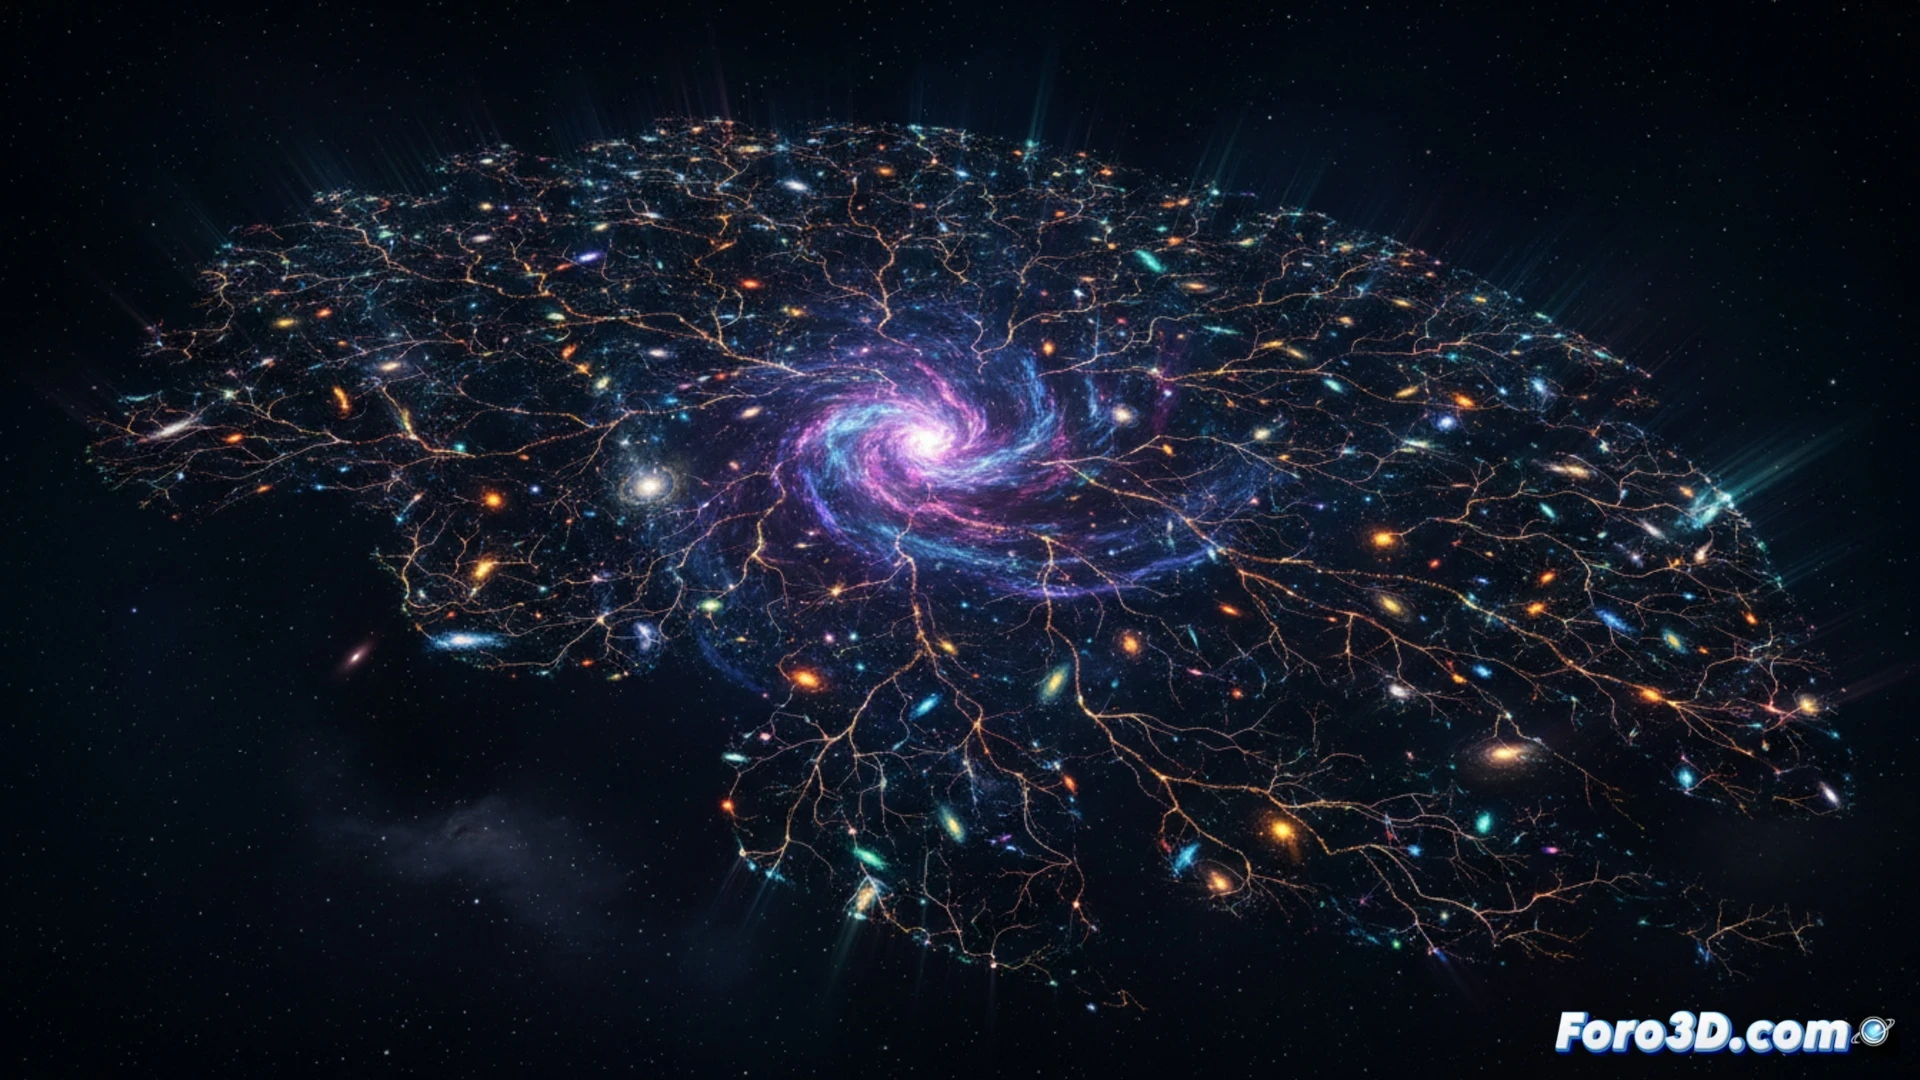
The construction of this map relies on two fundamental technical pillars. First, high-precision spectroscopy breaks down the light from each galaxy to analyze its chemical composition and velocity. Second, the measurement of redshift allows calculating the exact distance of celestial objects: the farther a galaxy is, the faster it recedes, and the more its light shifts toward the red end of the spectrum. By combining millions of these measurements, researchers generate a three-dimensional point cloud representing the relative positions of galaxies across 11 billion years of cosmic history. This technique visualizes the cosmic web, a filamentary structure of dark matter and galaxies that reveals how dark energy has modified the universe's expansion over time.
Scientific Visualization: From Abstract Data to Understanding the Cosmos 🔭
For the scientific visualization community, this map represents a milestone in representing massive data. The images generated from the DESI catalog are not only visually stunning but also function as analytical tools: patterns of galactic clustering allow astronomers to model the evolution of dark energy. In outreach, these visualizations transform abstract concepts into tangible experiences, allowing the public to virtually tour the universe and grasp, at a glance, the immensity of time and space surrounding us.
How is the 3D visualization of the universe map being used to identify patterns in the distribution of dark energy, and what technical challenges does its real-time representation present?
(PS: modeling manta rays is easy; the hard part is making them not look like floating plastic bags)