Software architecture, a pillar of digital transformation, hides a silent public health crisis. Recent epidemiological data place these professionals at a critical point: 78% report severe eye strain, 65% suffer from pathological sedentary behavior, and the incidence of burnout reaches 45%, double the average of other technical trades. This article analyzes the spread of these disorders using interactive 3D models, offering a visual and quantitative perspective for prevention.
3D Modeling of Incidence and Occupational Heat Maps 🧊
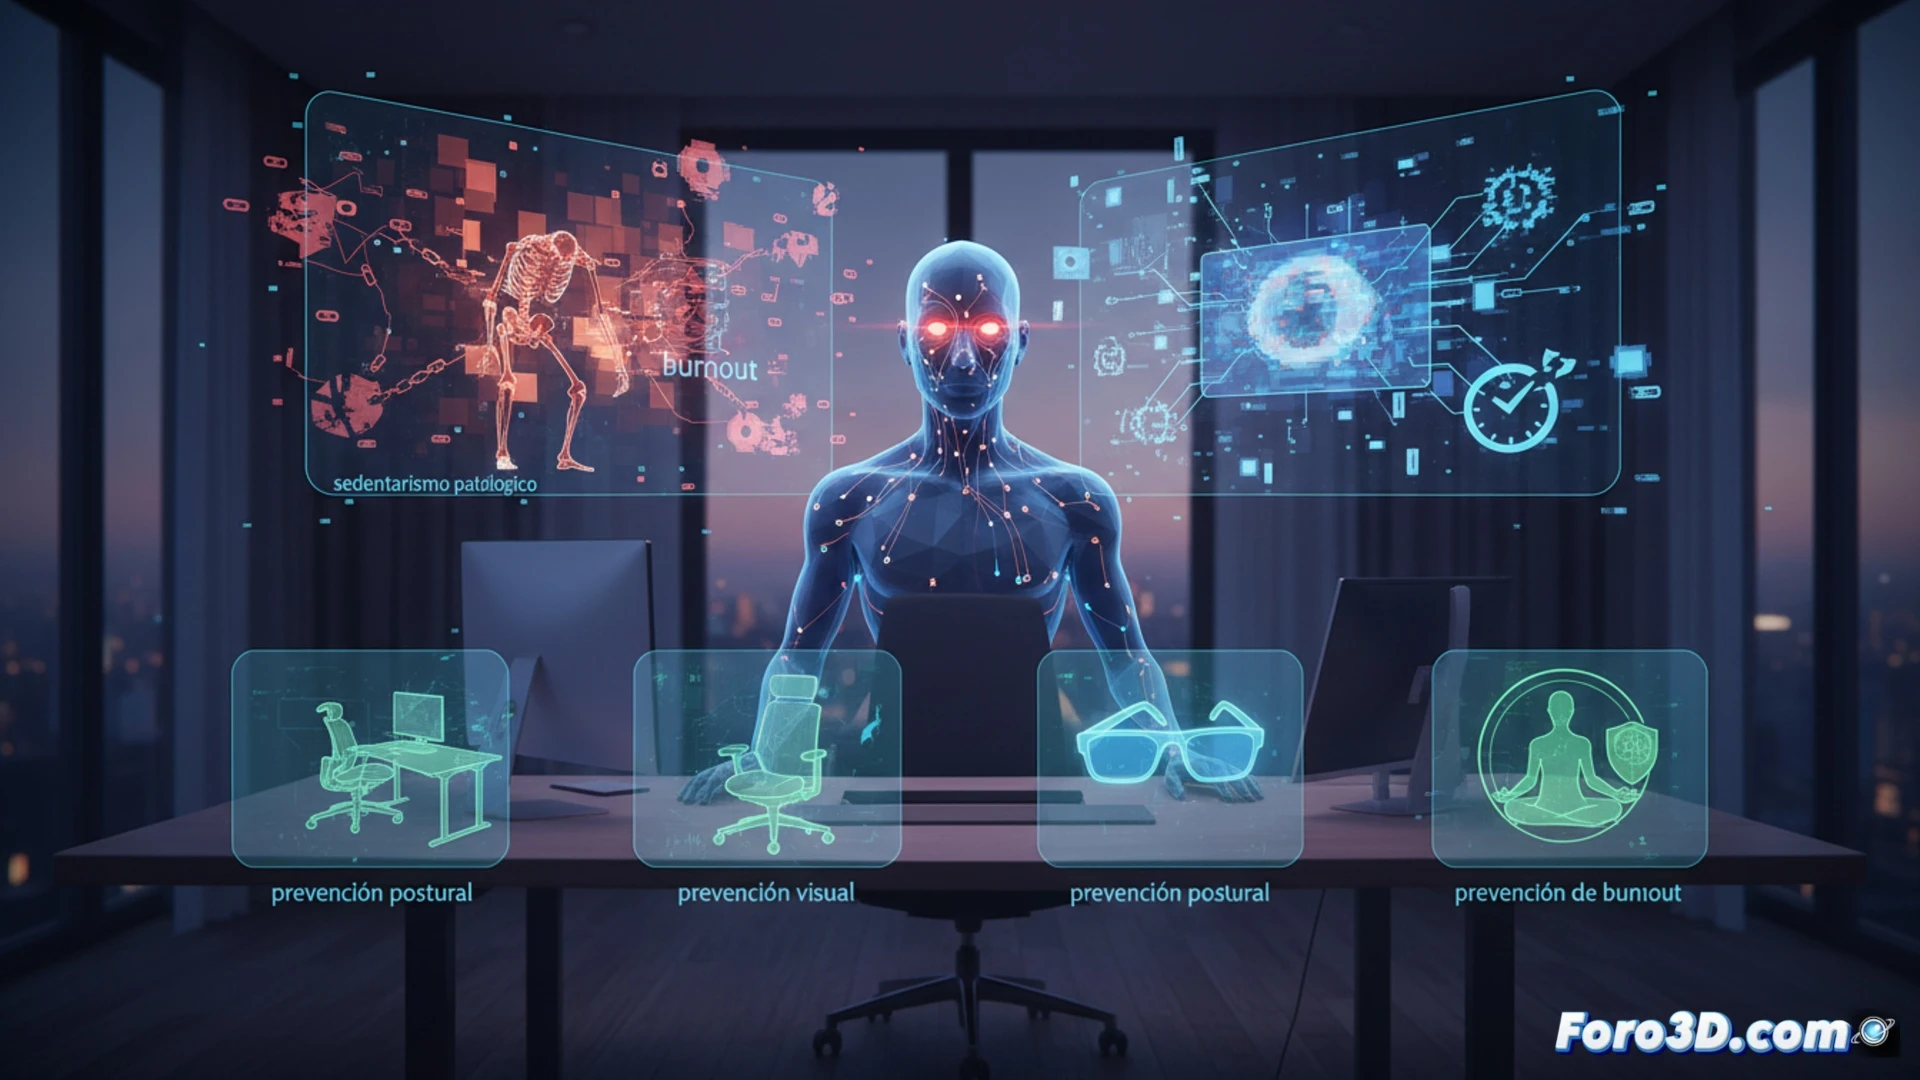
To visualize the problem, we have developed a 3D infographic that correlates three key variables: effective screen time, technical decision load, and cortisol levels. The model shows a heat map over the software architect's anatomy, where red zones (neck, lower back, and eyes) indicate a 55% incidence of musculoskeletal disorders. Compared to trades like graphic design or systems administration, the software architect presents a 30% higher risk of chronic stress, due to the combination of tight deadlines and the responsibility of irreversible architectural decisions. The burnout simulation, based on 2024 survey data, projects that without intervention, 60% of professionals will reach a state of extreme exhaustion in less than 5 years.
The Invisible Epidemic in the Office of the Future 🔍
Eye strain is not just a symptom, but an indicator of an unsustainable work system. Heat maps of screen time reveal that software architects accumulate an average of 11 hours daily, exceeding the safe limit recommended by the WHO. The 3D infographic allows rotating and exploring the highest-risk areas, showing how prolonged sedentary behavior and eye strain become public health problems when scaled to the entire tech population. The solution is not just ergonomic: it requires a redesign of workflows and active breaks integrated into the development cycle, visualized here as dynamic 3D recommendations for effective awareness.
Can epidemiological projections of eye strain in software architects, modeled in 3D environments, redefine occupational risk thresholds in public health codes?
(PS: at Foro3D we know that the only epidemic affecting us is the lack of polygons) 🏗️