The decision to release strategic oil reserves, announced by Spain, is a key geopolitical maneuver. Beyond the raw data, this crisis reveals the intricate network of global dependencies. This is where 3D modeling and simulation emerge as essential tools. They allow transforming abstract figures into interactive visual systems, where one can understand the true scale, critical connections, and pressure points of the global energy supply chain.
From Data to Simulation: 3D Tools for Strategic Analysis 🧠
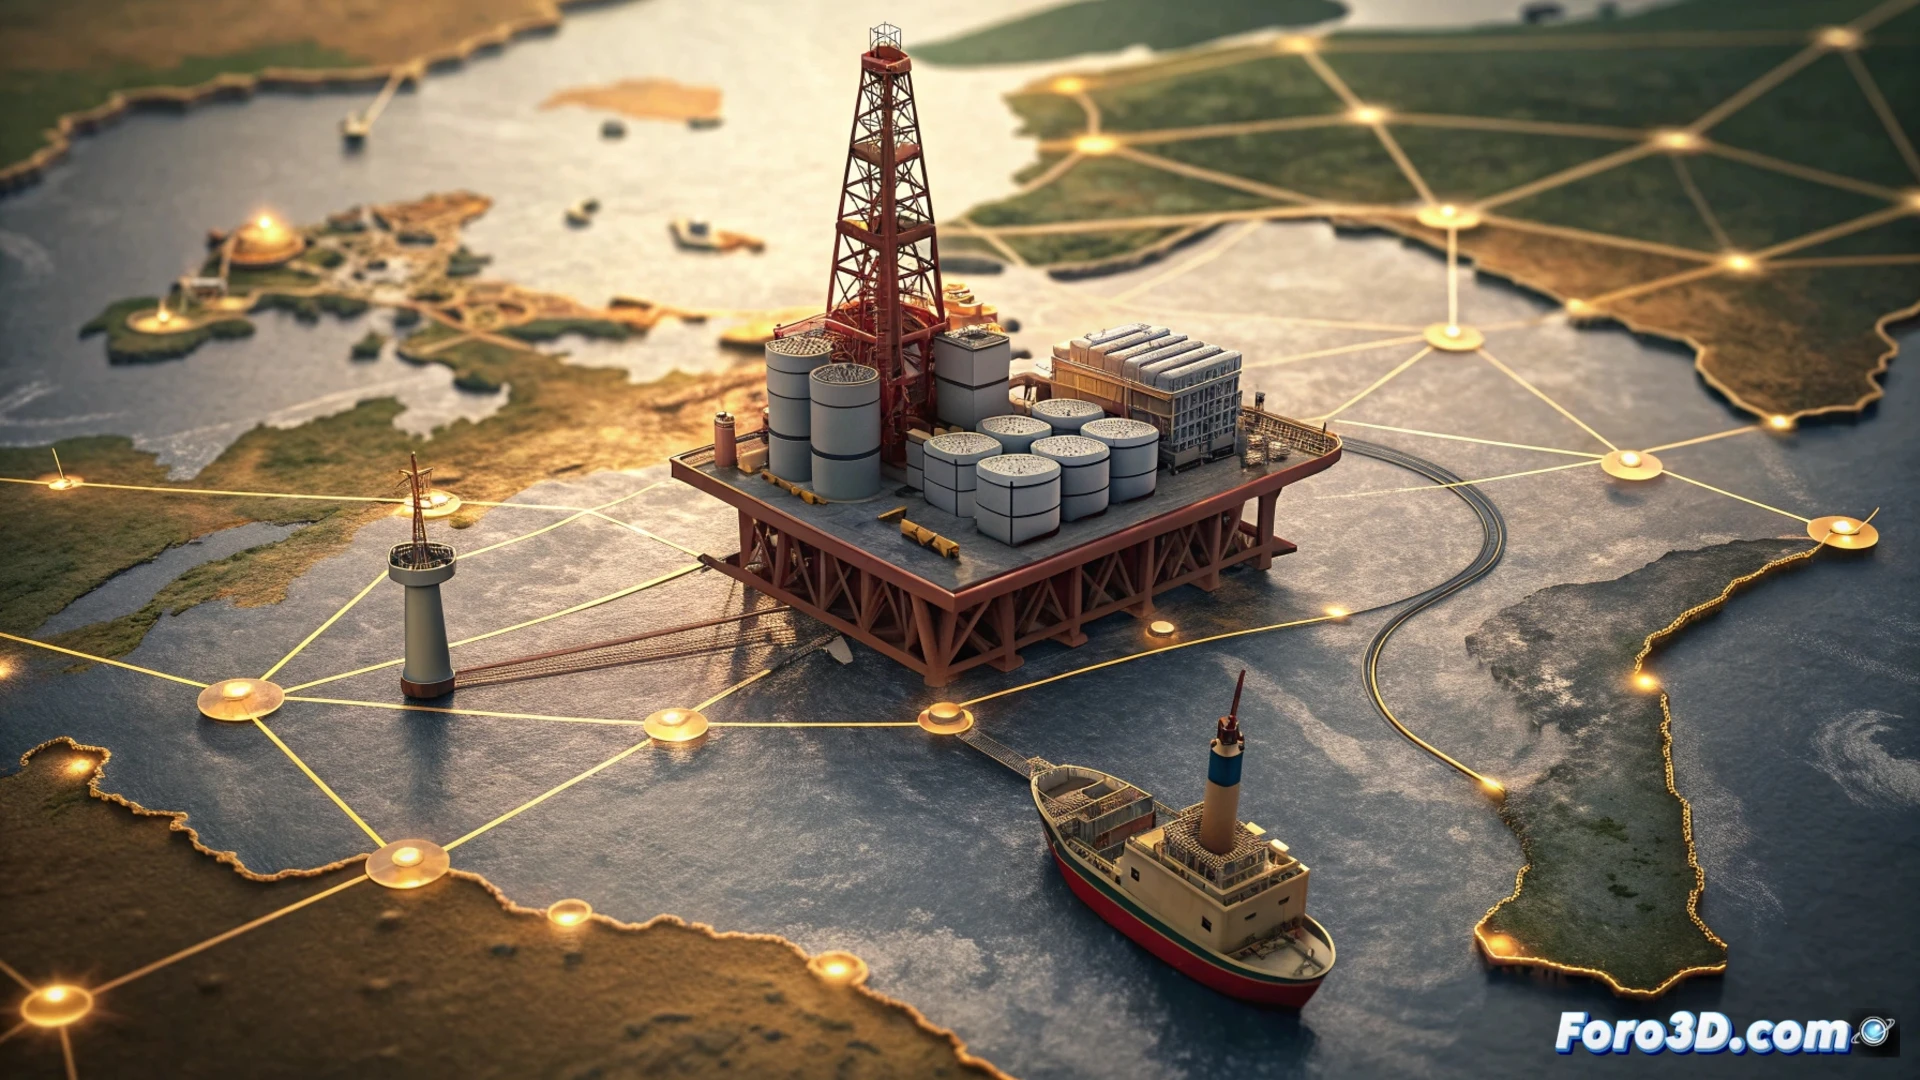
A 3D geospatial model allows real-time visualization of the status of strategic reserves for each IEA member country, showing volumes equivalent to days of coverage, such as Spain's 92 days. The main crude maritime routes can be mapped, highlighting those affected by instability in the Middle East, and the flow of released barrels to refineries can be simulated. Through agent-based simulations, multiple scenarios can be projected: how prices respond to different release volumes, what the impact is on transportation logistics, and how global supply is redistributed. This turns the political decision into a dynamic and analyzable system.
Beyond the Crisis: Modeling Energy Resilience 🛡️
The true power of these visualizations lies not only in analyzing the current crisis, but in designing future resilience. A comprehensive 3D model of the supply chain can identify single points of failure, excessive dependencies on geopolitically fragile corridors, and the real response capacity of the system. By simulating disruptions of varying magnitudes, planners can evaluate long-term strategies, from source diversification to optimal reserve sizing. 3D technology allows us not only to react, but to anticipate and strengthen global critical infrastructure.
What tool would you use to create an interactive geopolitical risk map?