The growing evidence linking the consumption of ultra-processed foods with health risks poses an educational challenge. How to communicate clearly and effectively the complexity of their formulation and effects? This is where 3D modeling and visualization emerge as powerful tools for nutrition outreach, allowing to break down and examine these products in an intuitive and accessible way for our entire community.
Comparative 3D Modeling: From Raw Material to Ultra-Processed 🍞
The educational power of 3D lies in visual comparison. We can create interactive models that show, on one hand, the integral structure of a natural food, like a grain of cereal, and on the other, its ultra-processed version, like a sugared breakfast cereal. The disassemblable model would reveal the breakdown into refined ingredients, the addition of additives like emulsifiers or colorants represented as differentiated geometric objects, and the loss of fiber. This spatial visualization helps understand that the problem is not just isolated nutrients, but the very architecture of the food and its extreme industrial transformation.
Beyond Correlation: Simulating Mechanisms ⚙️
3D visualization can go beyond composition. Through animations or simple simulations, we can represent hypotheses such as ingestion speed, differential hormonal response, or caloric density, mechanisms that that key 2019 study suggested are crucial. Turning complex metabolic data into an intuitive visual flow allows us to explore causality, transforming scientific information into tangible knowledge and promoting deeper technical discussion in our forum.
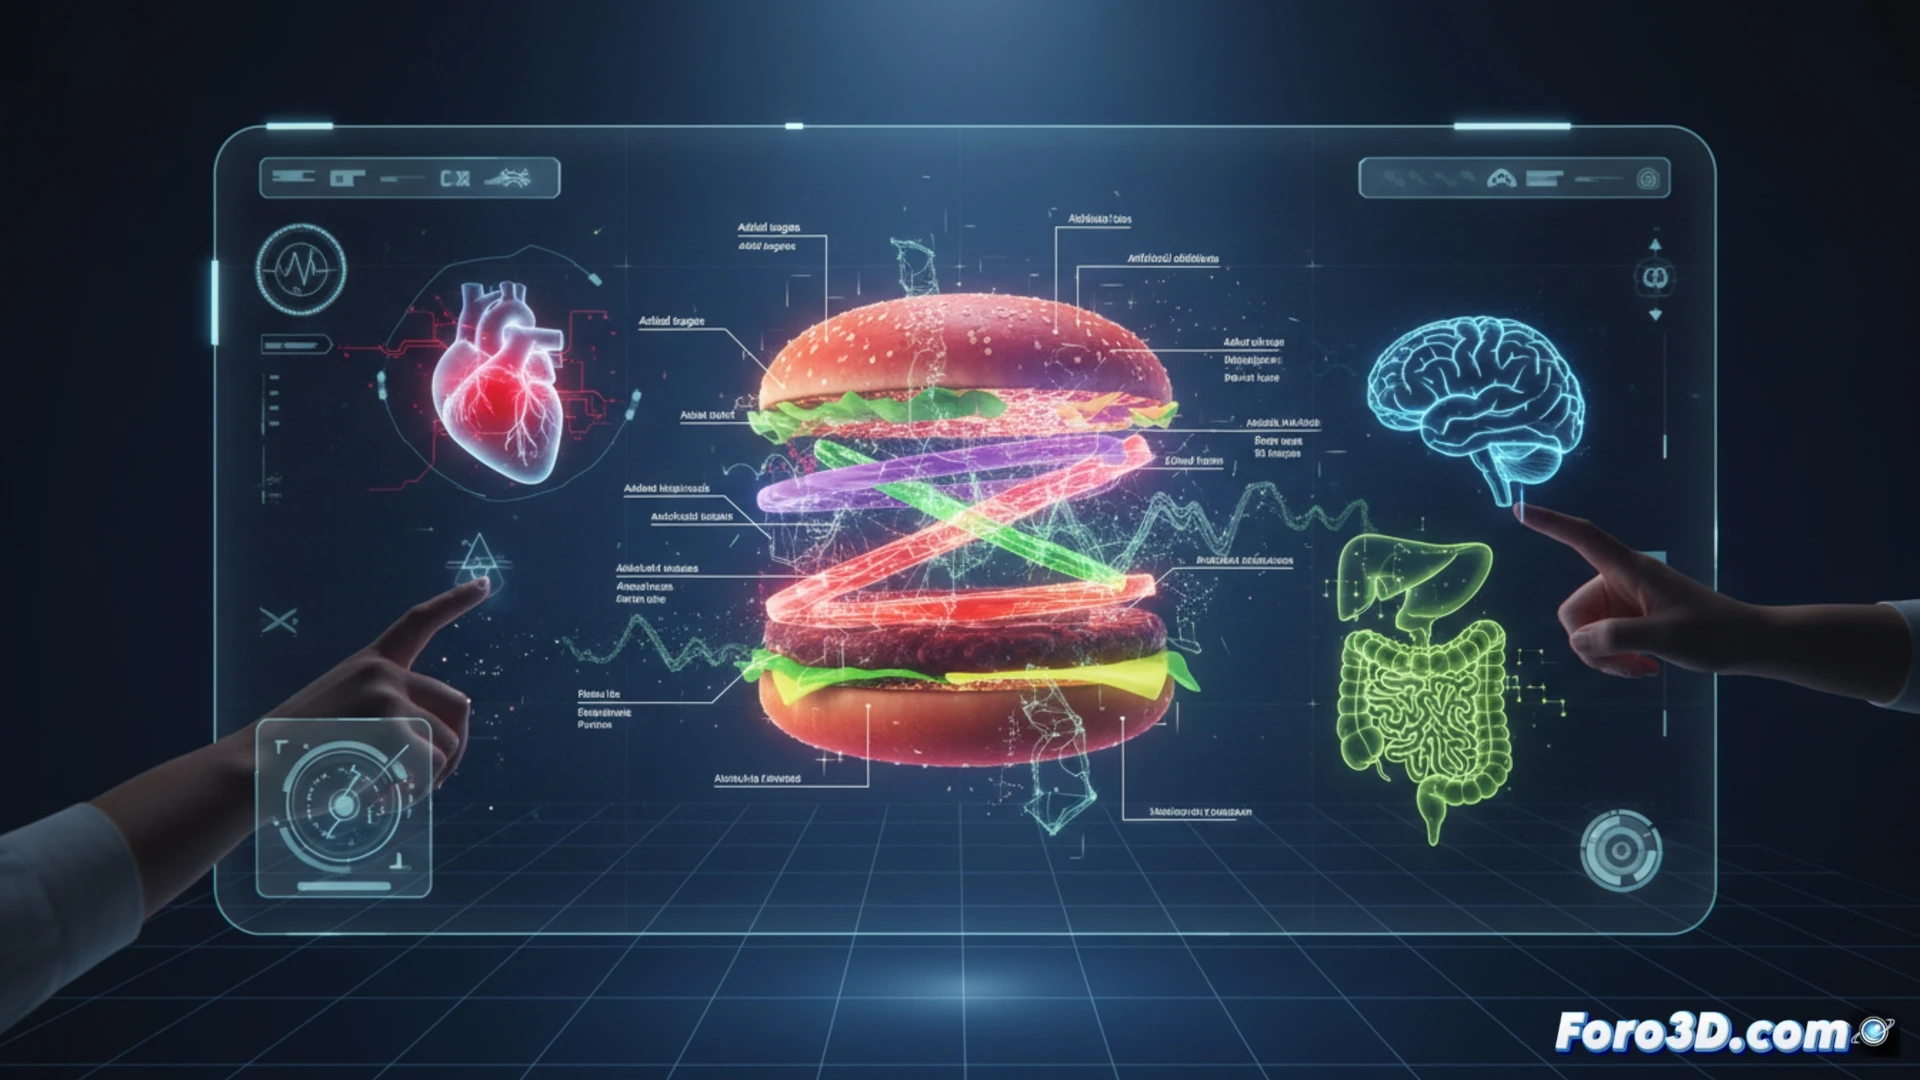
How can we use interactive 3D models to break down and visualize the molecular and additive structure of an ultra-processed food, making its impact on cellular and metabolic processes tangible?
(P.S.: virtual reality for kids: where carrots taste like pizza (if you program the shaders well))