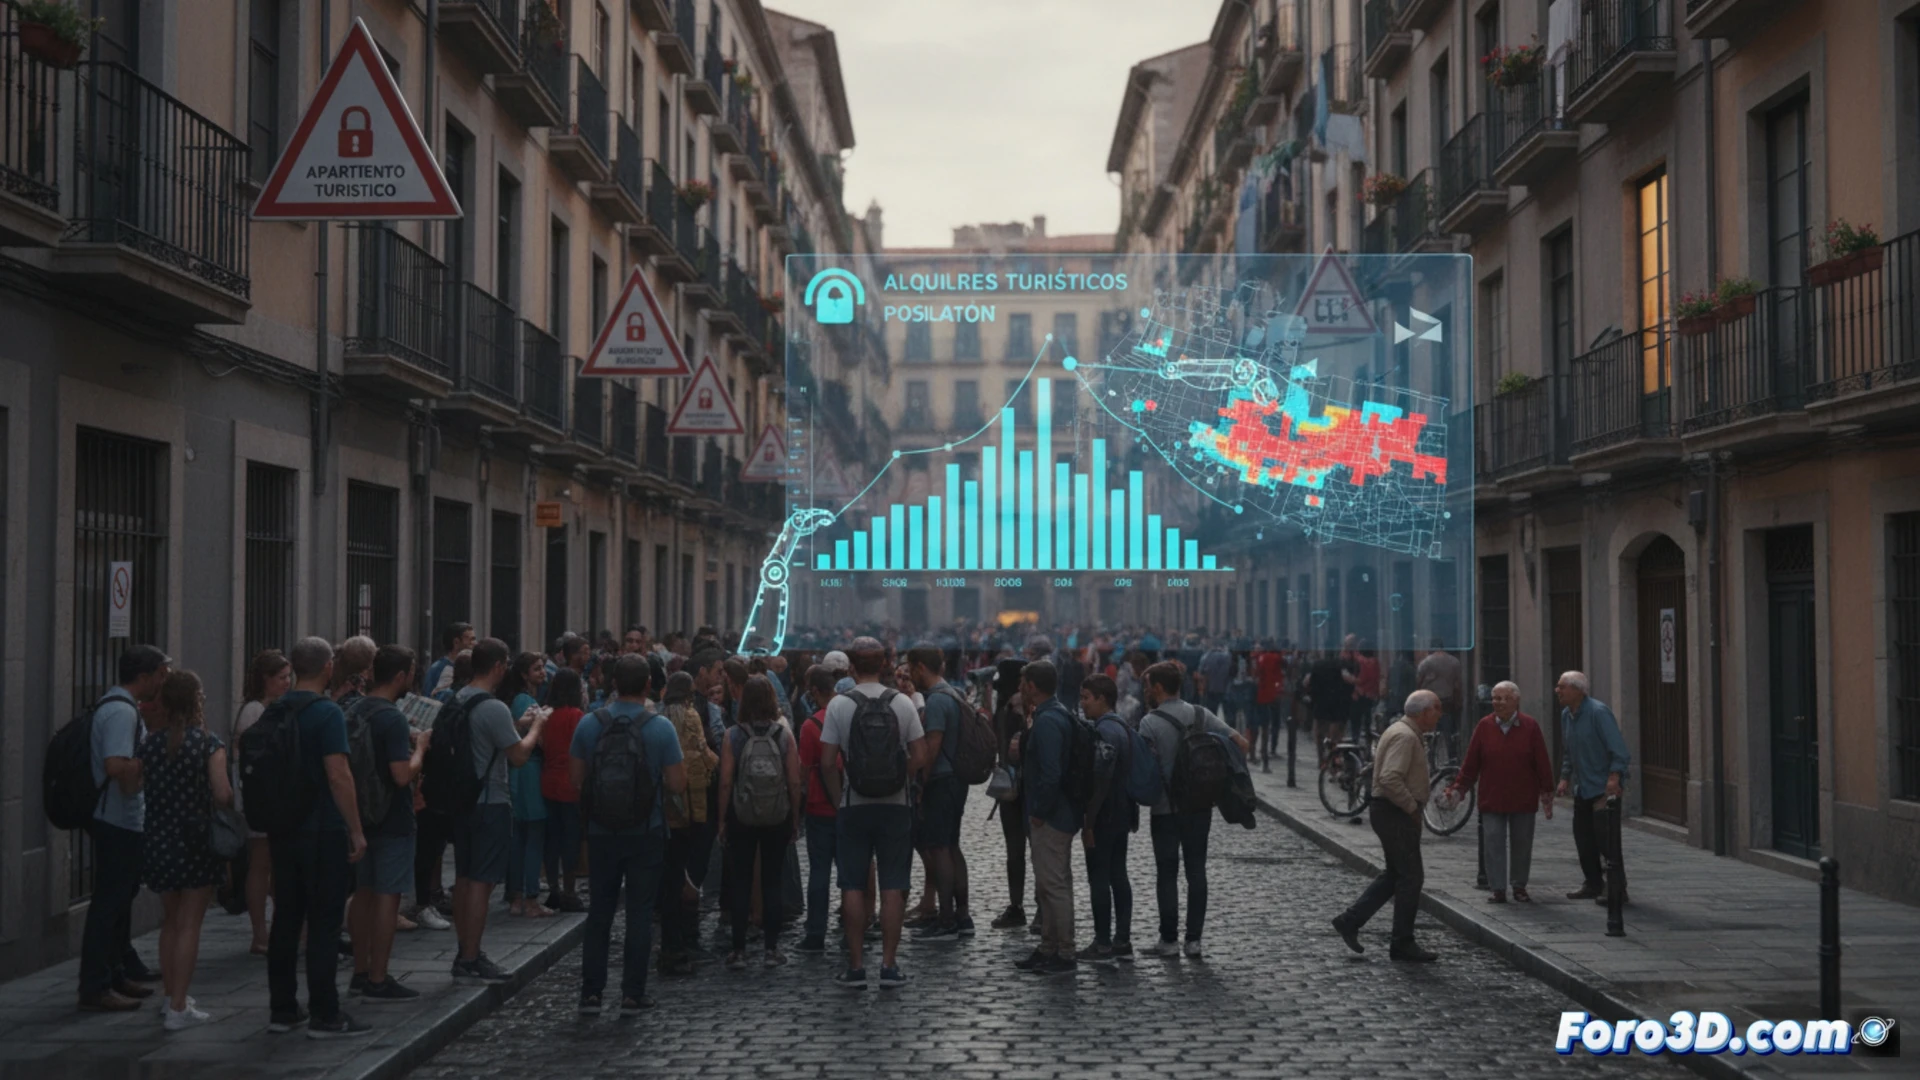
3D Tools for Spatial and Temporal Analysis of Touristification 🗺️
3D technology offers powerful resources to unravel this complexity. Interactive infographics can be developed that overlay layers of information on 3D models of cities. Imagine a map where, by navigating, the temporal evolution of rental prices by districts is visualized, correlated with the increase in licenses for tourist use housing. Or models that represent the density of tourist supply versus the variation in the young resident population. These tools allow identifying geographic and temporal patterns, transforming abstract data into an understandable visual narrative that illustrates the phenomenon of tourist pressure on the residential market.
From Visualization to Informed Participation 🧠
This technical approach transcends mere criticism. By modeling housing access data by demographic profiles and income, citizen participation based on evidence is fostered. The clear visualization of the consequences of public policies empowers the voter to demand concrete responses beyond generic promises. The conclusion is not simply electoral, it is methodological: only with a deep and accessible understanding of the problem, supported by data and its spatial representation, can effective solutions be demanded and designed that prioritize the right to housing over speculation.
How can digital participation tools and data visualization empower citizenship to contrast political discourses with the reality of the housing crisis in Spain?
(PD: interactive infographics are like politicians: they promise participation but sometimes they don't load)