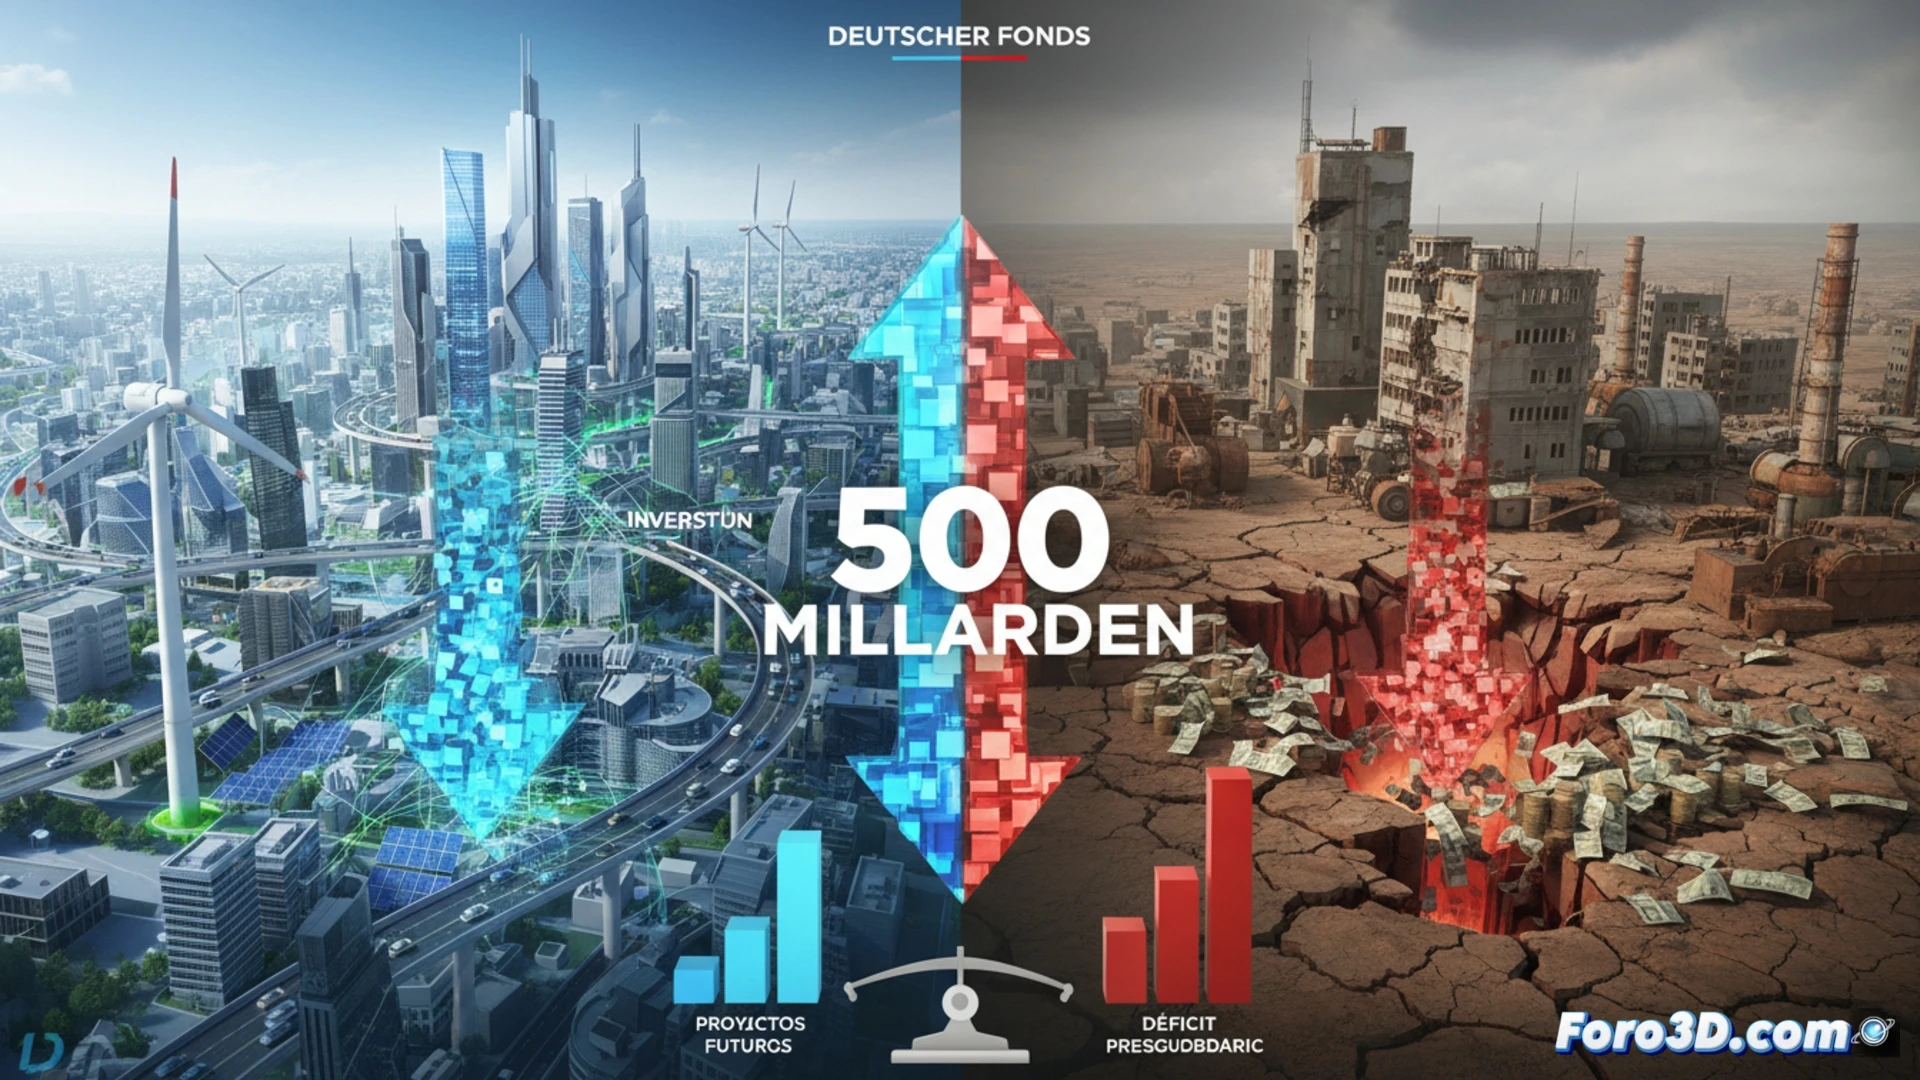
The debate over the use of a special fund of 500 billion euros in Germany highlights the need for transparency. While the government defends its allocation to infrastructure and climate, economic institutes denounce that 95% covered existing deficits. 3D visualization becomes a crucial tool to transform this dispute of abstract figures into a clear and accessible spatial representation for public analysis.
3D Modeling to Deconstruct a Budget 💶
An interactive model would allow comparing the theoretical allocation with the real execution. Two volumetric structures equivalent to 500 billion could be created. One would show the planned blocks: green transport, renewable energies. The other, with 95% of its volume marked in another color, would represent the budget holes. Tools like Blender or Unreal Engine, with shaders that differentiate flows, would allow exploring this discrepancy in a tangible way, making the scale of the deviation comprehensible.
Beyond the Graph: Transparency in 3D 👁️
This case exemplifies how 3D financial visualization transcends aesthetics. It's not just about showing data, but about building a space for scrutiny. A well-designed model forces confrontation with the magnitude of decisions, making government figures less abstract. It's a bet on more intuitive accountability, where citizens can, literally, observe the fate of their resources.
How can 3D data visualization transform the abstract debate on the allocation of a 500 billion euro fund into a tangible tool for transparency and public scrutiny?
(PS: financial virtual reality: where you can see your money disappear in high definition)