A study in Science has discovered the oldest evidence of tectonic movement, dated 3.480 billion years ago in Pilbara, Australia. This finding, which rewinds the geological clock by 140 million years, underscores the crucial importance of this process for climatic stability and life. To grasp the magnitude of a continental displacement of 2,500 kilometers, 3D scientific visualization becomes an indispensable tool.
Paleomagnetism and 3D Modeling: Reconstructing Ancient Drift 🌍
The research is based on paleomagnetism, analyzing the orientation of magnetic minerals in rocks to determine their original latitude. Here, 3D visualization can transform these abstract data into an interactive model. We could create an animation showing the slow drift of the Pilbara craton toward the ancient south pole, complemented by cross-sections that reveal the alignment of magnetite crystals within the rock. Such a model allows geologists and students to explore the spatial relationship between the samples and the fossilized magnetic field.
Beyond the Data: Simulate to Educate and Discover 🧠
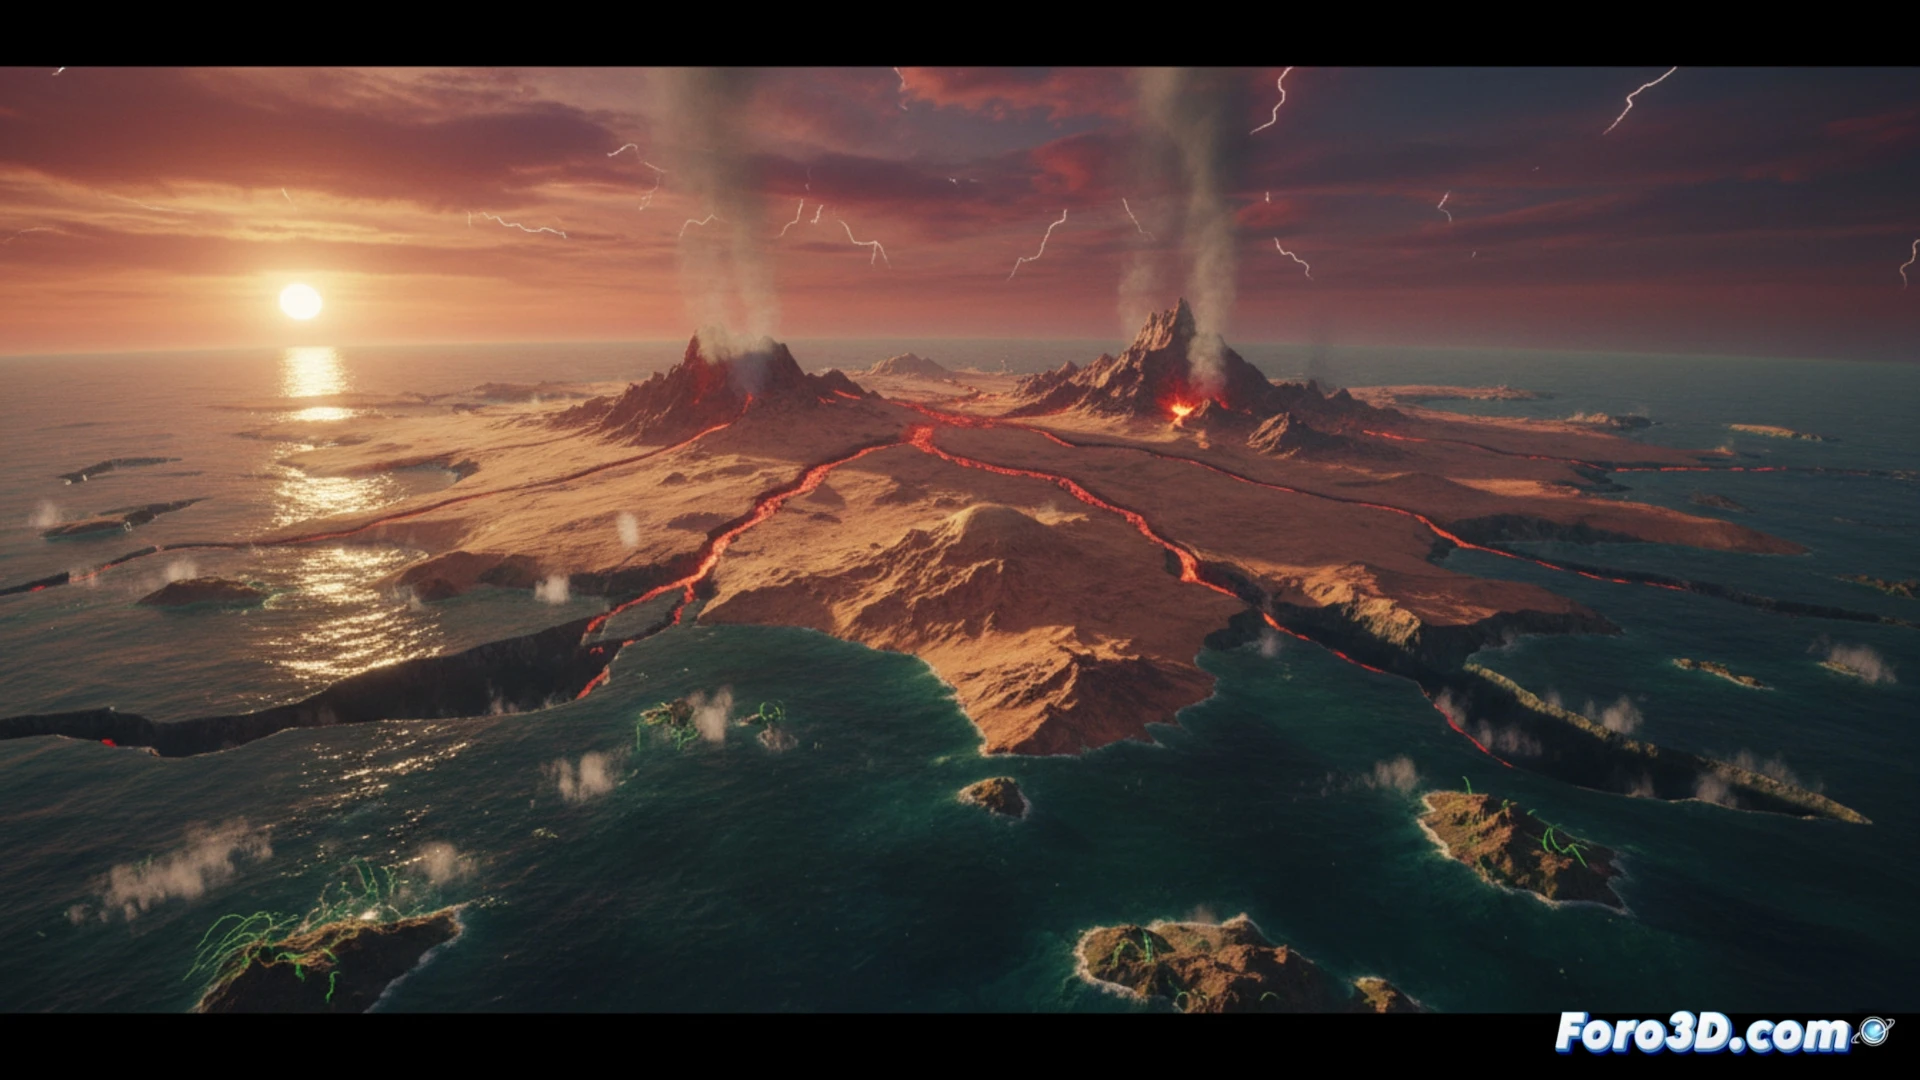
The true power of visualization lies in its ability to simulate processes. A dynamic model of the primitive tectonic process, showing the possible interaction of plates and their surface recycling, would be a powerful outreach tool. It not only communicates a finding but fosters intuitive understanding of a complex system that shaped our planet and made life as we know it possible.
How can modern scientific visualization techniques be applied to recreate and analyze tectonic processes from 3.480 billion years ago based on data from the Pilbara craton?
(P.S.: modeling manta rays is easy, the hard part is making them not look like floating plastic bags)