Firefly Aerospace's Blue Ghost mission has obtained the first thermal measurements outside the lunar PKT region, rich in radioactive elements. Data from the Mare Crisium basin reveal subsurface heat similar to that zone, challenging the theory that lunar mare volcanism was driven solely by that radioactivity. This discovery raises new questions about the Moon's geological evolution. 🌕
3D Modeling to Unravel Lunar Thermodynamics 🗺️
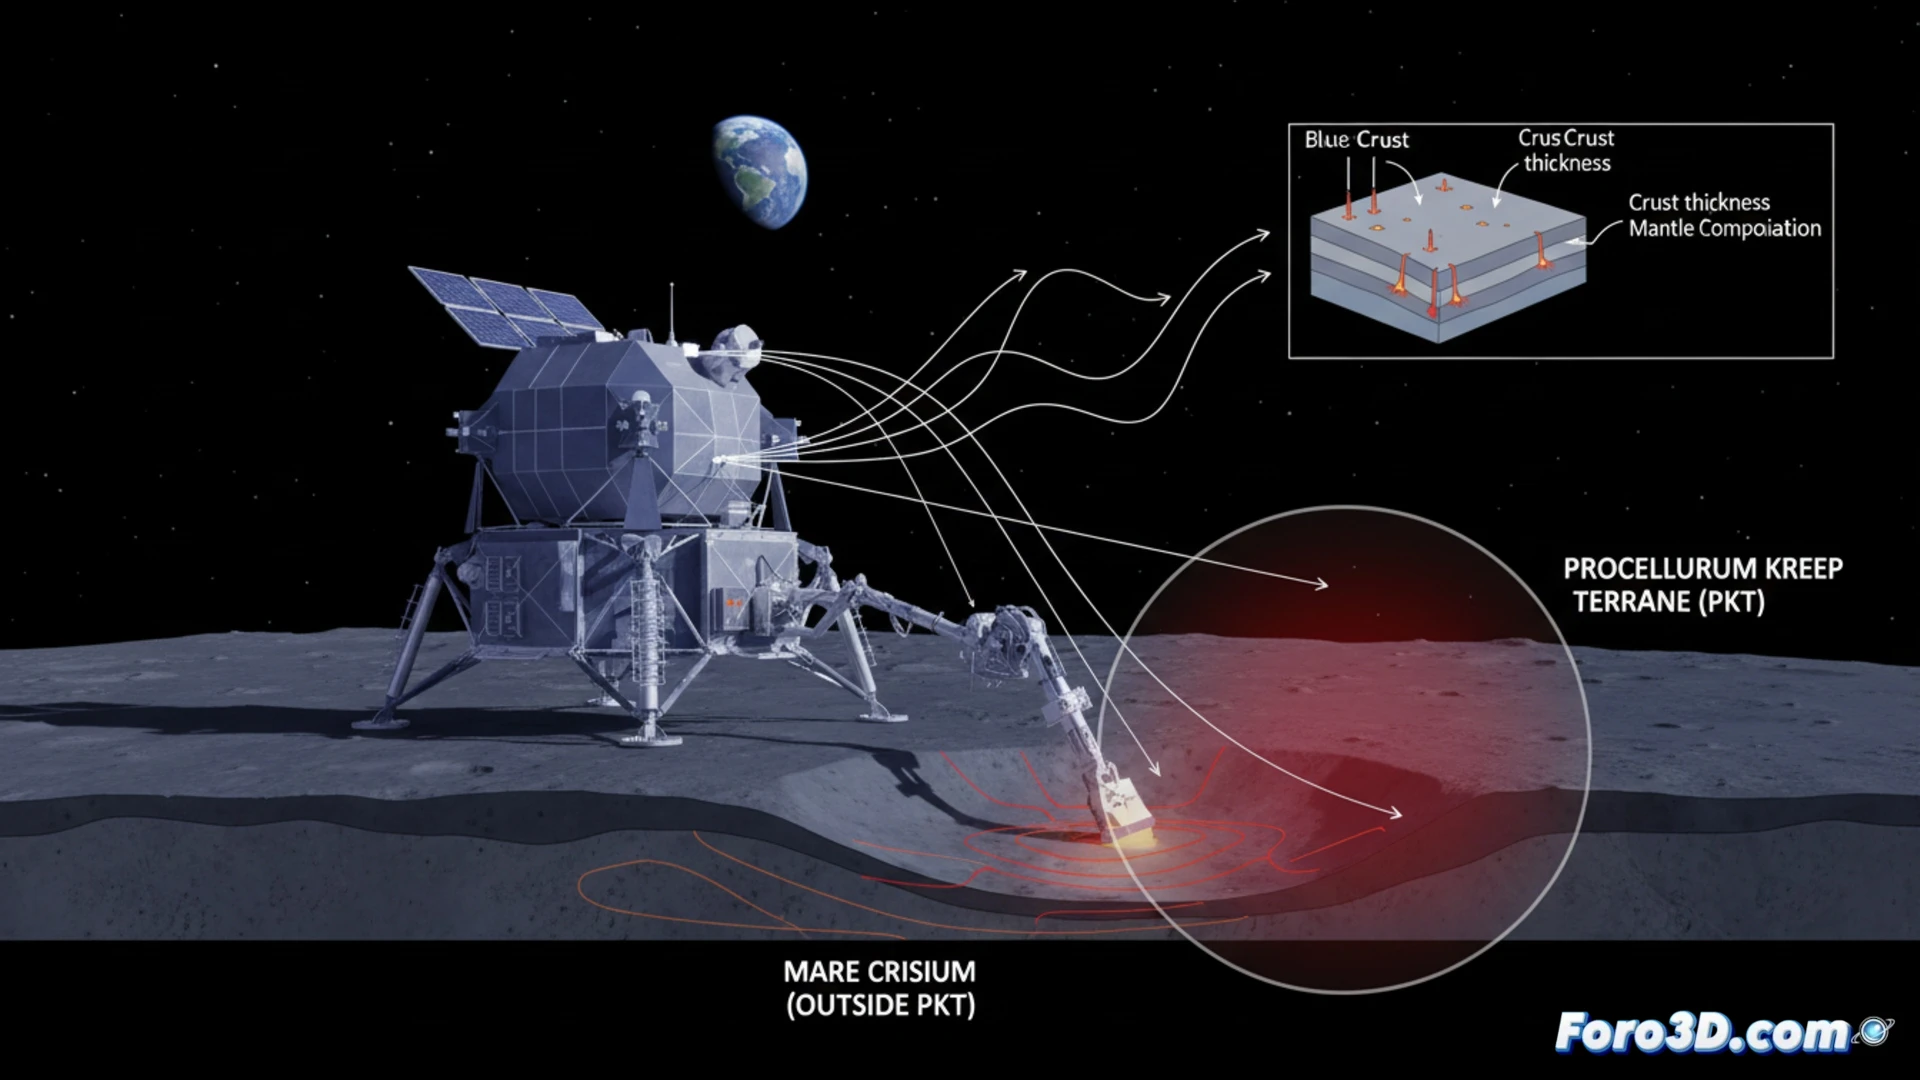
This is where scientific visualization becomes crucial. To understand this finding, interactive 3D models of the lunar subsurface are required that integrate the new thermal data. Imagine a volumetric map of Mare Crisium, where temperature gradients and heat flows at depth are visualized. Comparing this model with a similar reconstruction of the PKT region would allow identifying subtle differences in heat distribution. These visualizations are not just illustrations; they are analytical tools that enable planetary geologists to test hypotheses about crustal thickness or mantle composition, factors now reconsidered.
The Visual Narrative of a Paradigm Shift 👁️
The true power of 3D visualization lies in its ability to communicate a conceptual shift. A clear comparative model can convey at a glance how a local datum in Crisium forces a rethinking of global theories. By making the subsurface tangible, these tools transform numerical data into an understandable narrative, both for scientists and the public, demonstrating that sometimes, to see the Moon with new eyes, you first have to model what cannot be seen.
How can the scientific visualization of lunar thermal data challenge established models about the geological evolution of impact basins?
(P.S.: modeling manta rays is easy, the hard part is making them not look like plastic bags floating)