Financial markets react in a complex and simultaneous manner to geopolitical events. An announcement about a possible delayed attack can make indices rise and crude oil plummet in minutes, as has happened recently. This multivariable dynamic, where politics (cause) impacts financial assets (effects), is the perfect scenario for applying 3D financial visualization techniques. A three-dimensional model can capture these interrelationships more intuitively than any 2D chart, allowing for real-time analysis of volatility and correlations.
Proposal for an Interactive 3D Model for Geopolitical Crises 📊
We propose a conceptual model with three main axes. The X axis would represent time or the intensity of the geopolitical event. The Y axis would show the percentage variation of the main stock indices. The Z axis, or a color scale, would reflect the price of oil. By introducing the data from Trump's announcement, we would see a 3D point where the Y axis rises (stock market rally) and the Z axis falls (oil prices down). Additional data layers, such as volatility (represented as the size or brightness of the point) or flows between sectors, would add depth to the analysis. This visualization would allow for immediate identification of patterns and divergences.
Beyond the Chart: Uncertainty as a Variable 🌪️
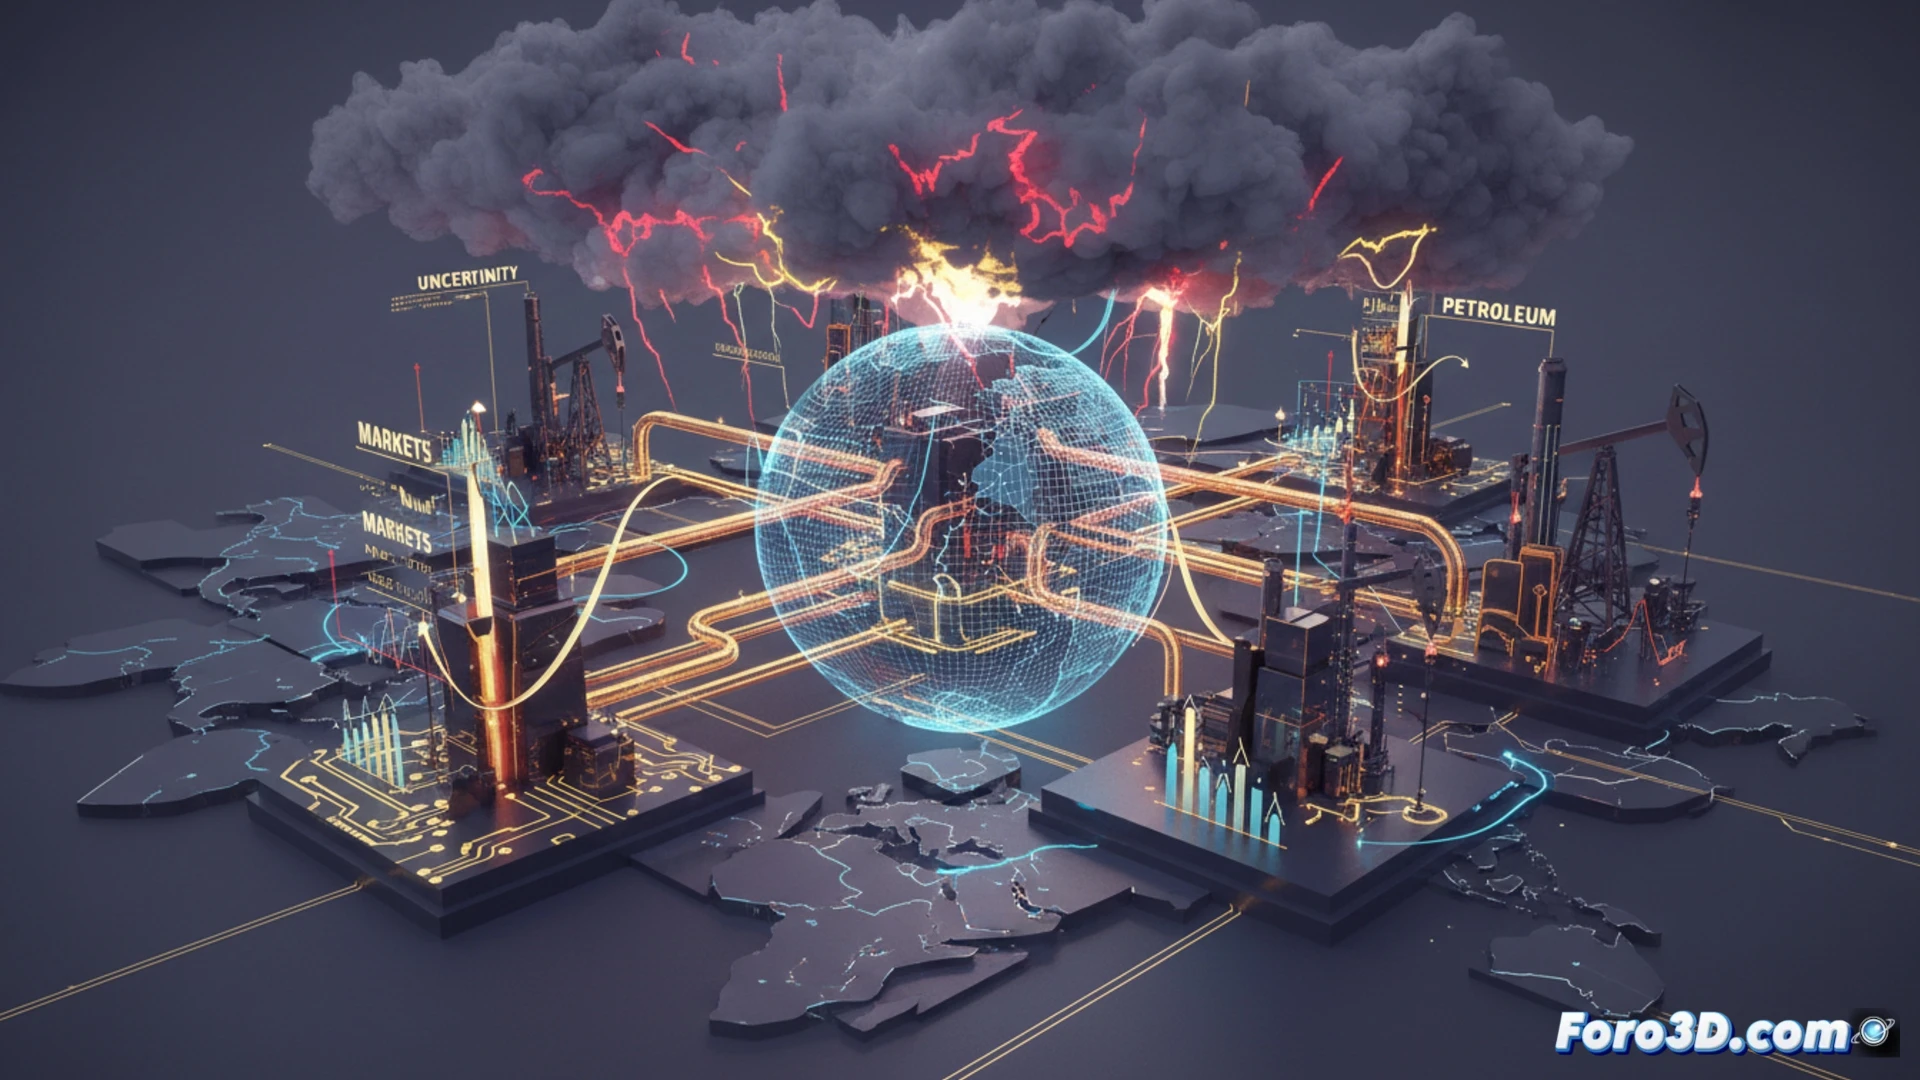
The true power of this 3D model lies in its ability to visualize uncertainty. Even if markets rise, the conflict remains active. An advanced model could represent this tension as a cloud or force field around the main trend, showing the probability of a breakout. 3D visualization reminds us that markets do not move in a simple plane of good and bad news, but in a multidimensional risk space where apparent calm can be fragile and subject to a sudden change in coordinates with a single headline.
How can the cascading impact of a geopolitical event, such as a crisis in the Strait of Hormuz, be modeled and visualized in 3D on oil prices, currencies, and stock indices in real time?
(P.S.: at Foro3D we know that the only interest that surely rises is that of our electricity bills)