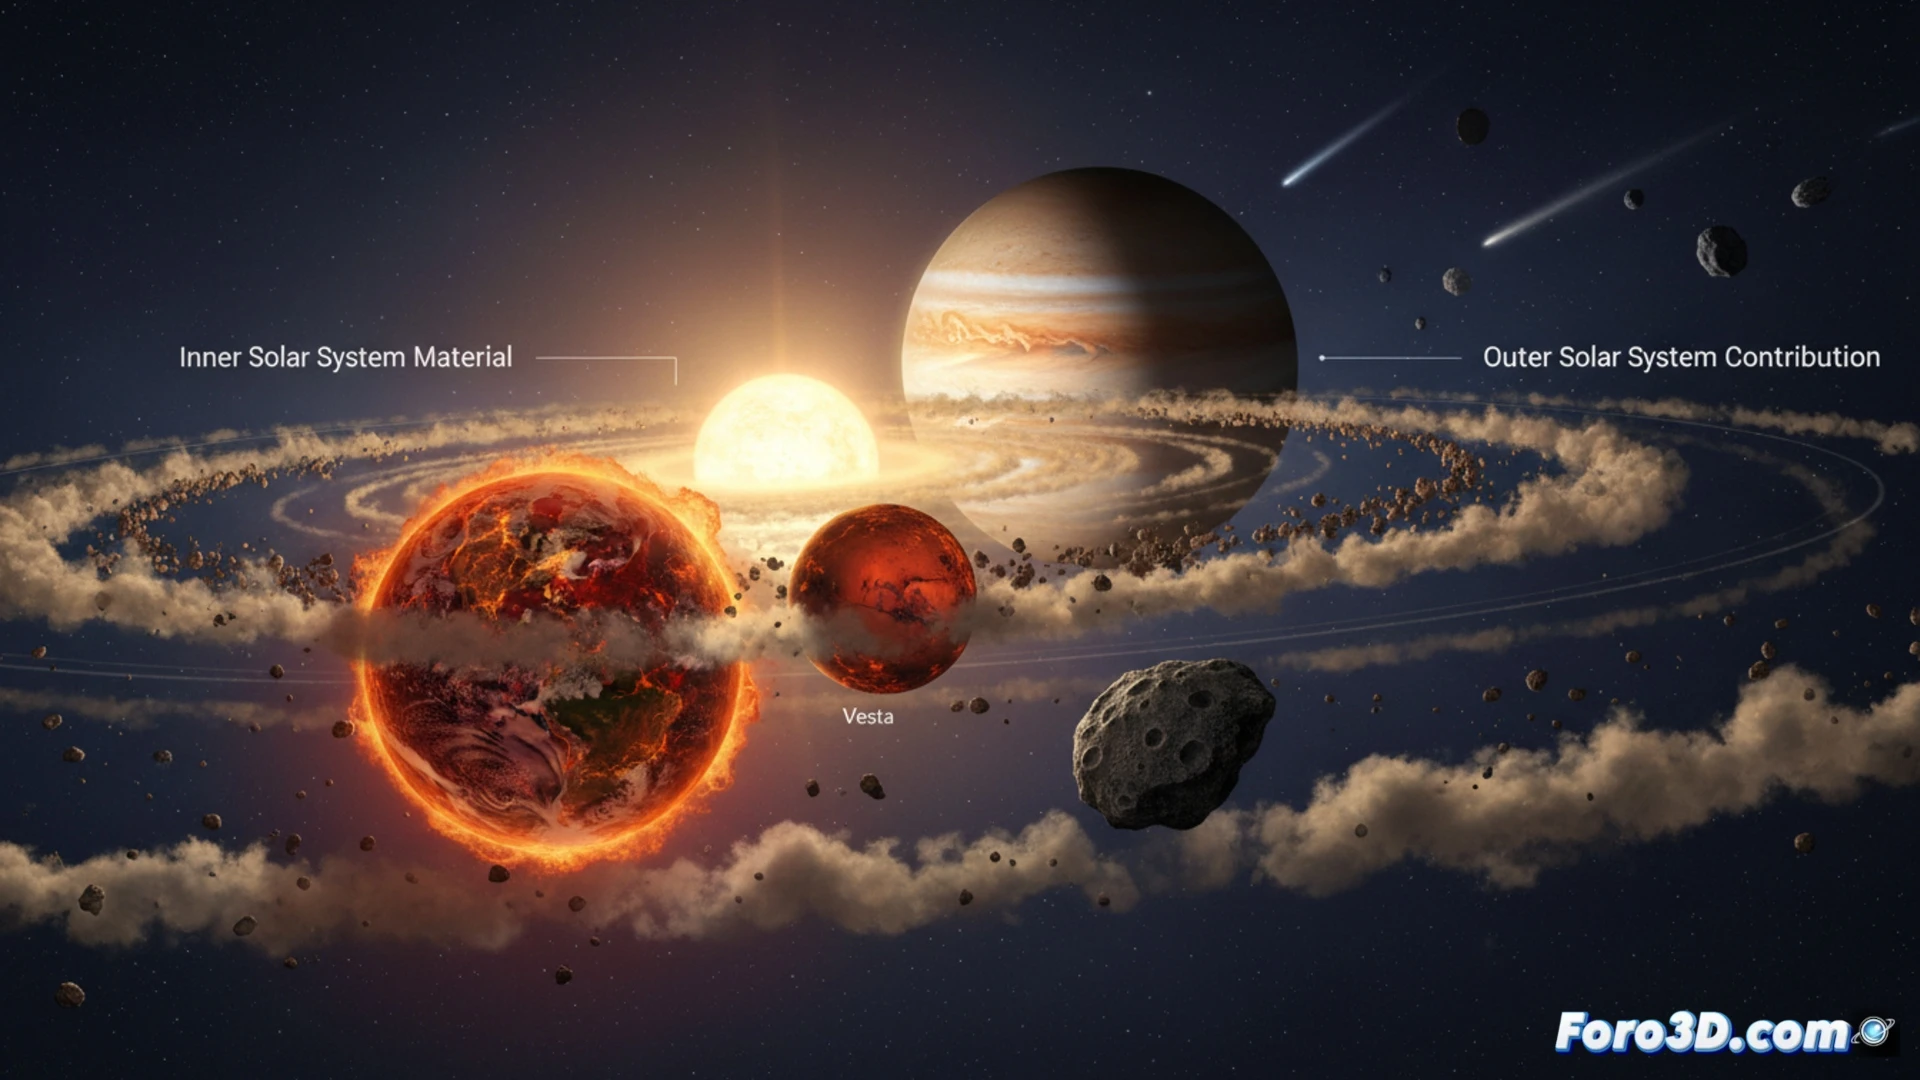
A revolutionary study in Nature Astronomy reveals that Earth formed almost entirely from material in the inner solar system, challenging previous theories. The isotopic analysis of meteorites and rocky planets shows a common composition, with less than 2% external contribution. This finding redefines planetary formation and suggests a local origin for volatiles like water, opening new avenues for research.
3D Visualization to Unravel Planetary Accretion 🔍
This discovery is ideal for scientific 3D visualization. We could model an interactive inner solar system, highlighting the common material reservoir of Earth, Mars, and Vesta with a unified color palette. Through comparative 3D infographics, key isotopic signatures, such as that of silicon-30, would be visualized, making the compositional similarity tangible. An animated simulation of planetary accretion would be powerful, showing how inner planetesimals merge, while material beyond Jupiter is gravitationally blocked, illustrating that 2% limit.
From Data to Educational Visual Narrative 🎬
The power of these visualizations lies in transforming complex data into a clear narrative. A 3D model allows the public to understand an abstract concept like a material reservoir, and an animation explains formation dynamics inaccessible to the naked eye. These tools not only communicate the finding but are also predictive instruments, allowing us to visually propose the probable composition of Venus and Mercury, based on the new paradigm.
How can we use scientific visualization techniques to model and represent the accretion of inner solar system material that formed Earth, according to the new isotopic data?
(P.S.: fluid physics to simulate the ocean is like the sea: unpredictable and you always run out of RAM)