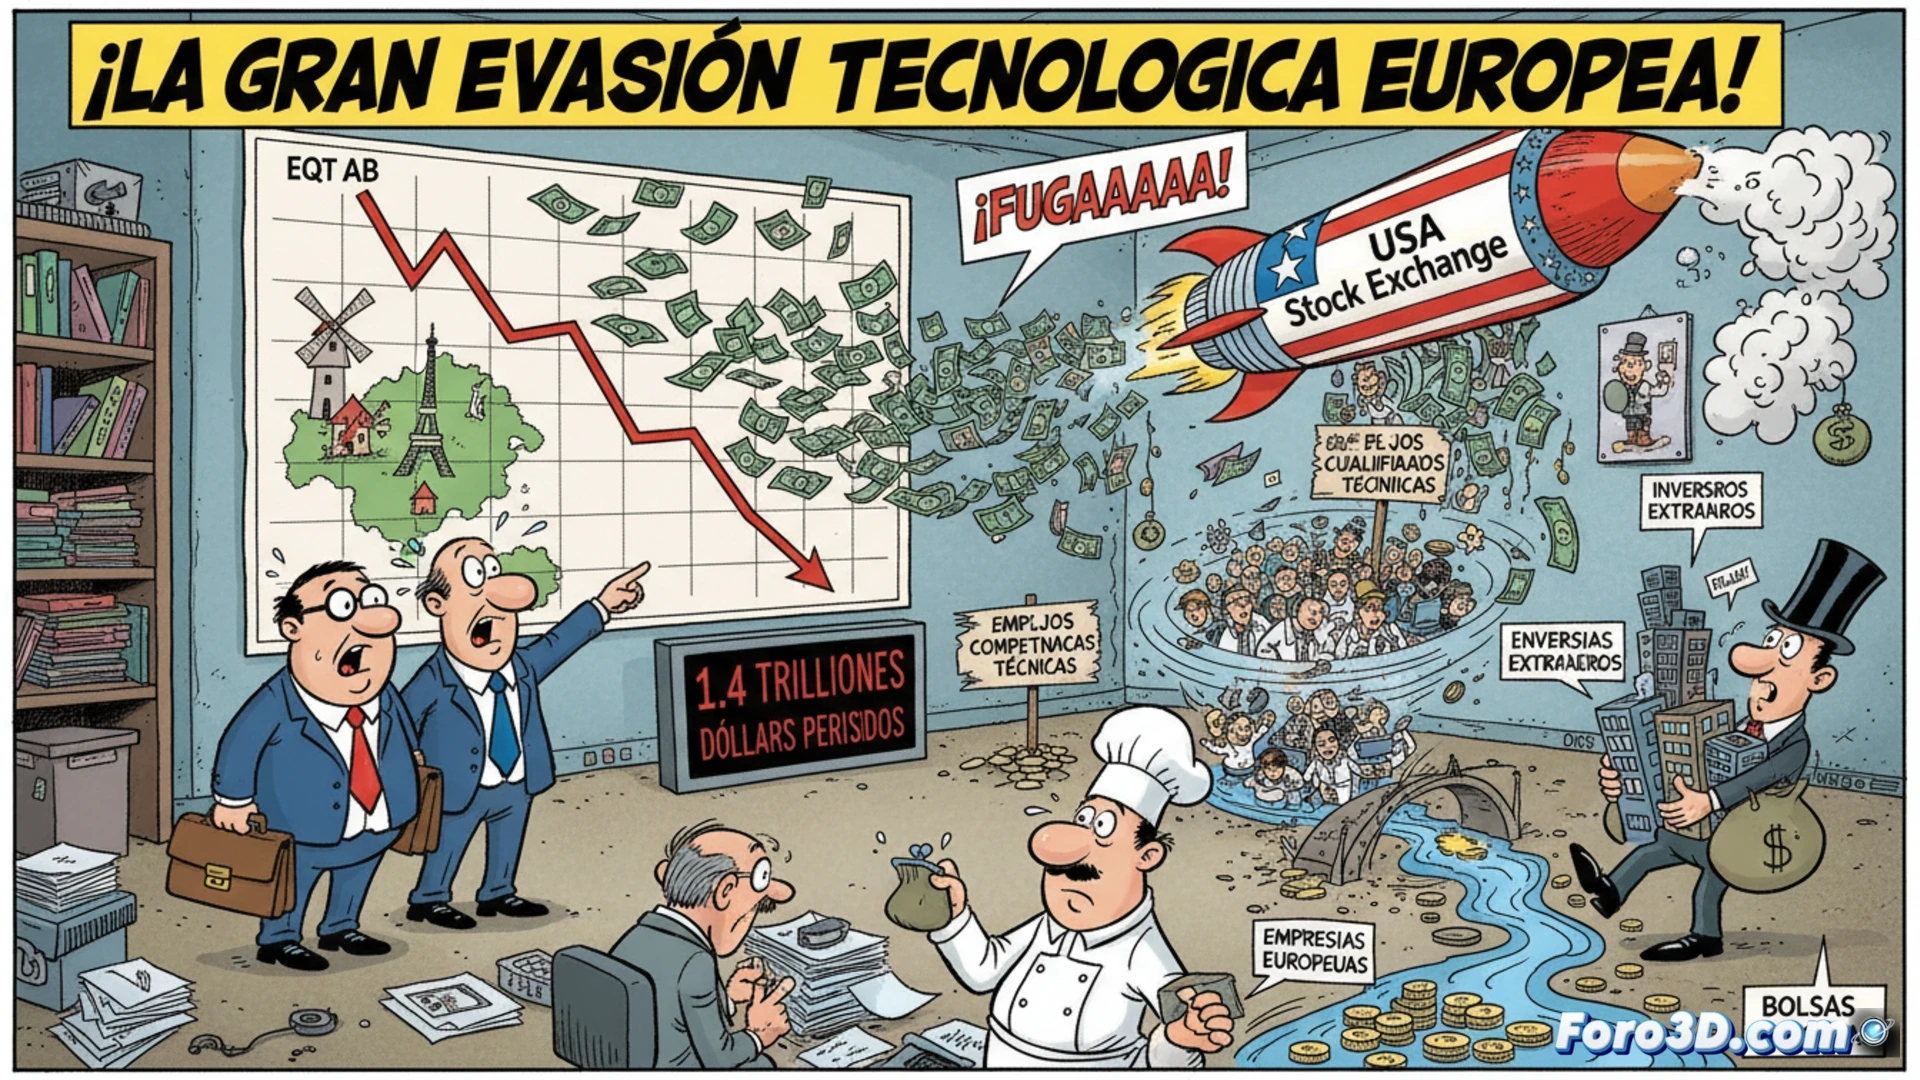
A study by EQT AB and McKinsey & Co. quantifies a critical economic hemorrhage for Europe: the loss of approximately 1.4 trillion dollars in capital investment between 2014 and 2025. This monumental figure represents the value of European technology companies that chose to list on foreign stock exchanges or sell to foreign investors. The direct consequence is a shift in the business center of gravity, typically towards the United States, eroding technological sovereignty and the regional capital market.
3D Visualization of Capital Flows and Decapitalization 📉
To understand the magnitude and dynamics of this phenomenon, we propose a 3D visual analysis model. An interactive infographic would show dynamic capital flows from Europe to the main stock market destinations, illustrating the 700 billion euros captured abroad to finance the local ecosystem. A 3D heat map overlaid on the continent would reveal the intensity of decapitalization by country. Complementarily, a comparative temporal chart would allow analysis of the evolution of domestic investment versus outflow, highlighting how financing on European stock exchanges loses relevance compared to the US option, perceived as simpler and more effective.
Industrial Consequences Beyond the Numbers ⚙️
This capital flight transcends the financial. Data visualization makes tangible the loss of technical skills and highly qualified jobs that migrate with the companies' decision-making center. Each capital flow outward in the 3D model also represents a flight of talent, innovation, and future industrial leadership capacity. The analysis reveals a vicious circle: the lack of a deep and agile capital market in Europe expels its technology champions, further weakening the ecosystem and its long-term global competitiveness.
How would you represent the correlation between geopolitical instability and prices?