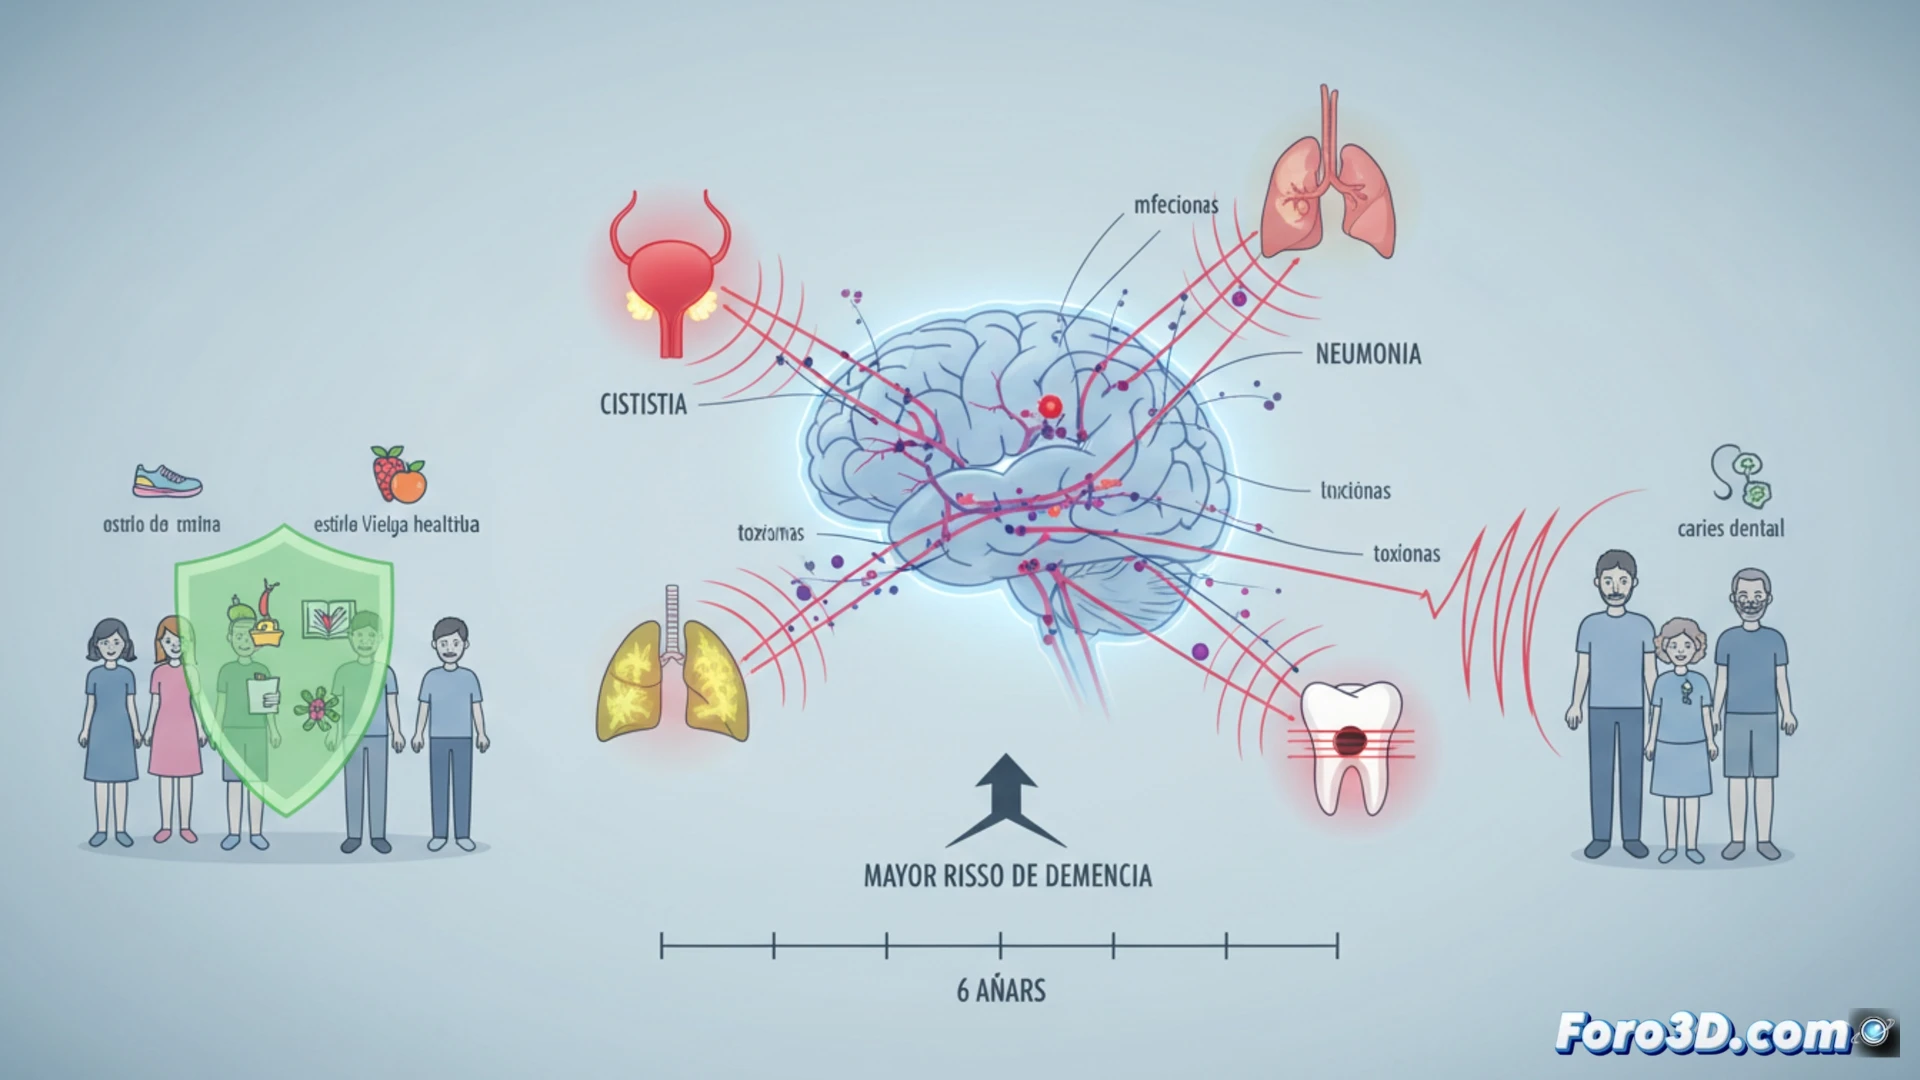
A large-scale Finnish study with hundreds of thousands of participants has revealed an alarming connection: serious infections requiring hospitalization, such as cystitis or pneumonia, significantly increase the risk of developing dementia in the following six years. This finding underscores the role of systemic inflammation as a possible trigger for neurological damage. From the visual epidemiology perspective, we can transform these complex data into comprehensible models that illustrate this population risk and help design preventive strategies.
3D Modeling and Temporal Graphics for an Inflammatory Hypothesis 🧠
Data visualization is key to understanding this phenomenon. Interactive incidence maps could be created that overlay hospitalization rates for infections and dementia diagnoses, revealing geographic correlations. More technically, 3D models of the circulatory system could simulate how systemic inflammation, originating from an infectious focus, compromises the blood-brain barrier, facilitating microhemorrhages or the passage of toxins. Complementarily, animated temporal graphs would show the risk peak in the six-year window following the infection, offering a dynamic perspective of the study.
From Data to Prevention: A New Layer in Public Health 🛡️
These findings not only expand the understanding of dementia but also add a crucial layer to public health policies. The prevention of common infections now emerges as a potential additional strategy to reduce population cognitive risk, alongside vascular factor control and lifestyle habits. Visualizing this link through 3D tools and robust graphics is fundamental to communicating the risk to the medical community and the population, driving greater awareness of the importance of rigorous infectious disease management.
What tools would you use to visualize the temporal evolution of this epidemic?