The James Webb Space Telescope has unveiled a visual mystery in the early universe: a population of small, bright red objects. Their mere detection is a technical milestone, but their true nature is a scientific puzzle. Are they unusually massive young galaxies, growing supermassive black holes, or something completely different? Solving this enigma depends, more than ever, on our ability to transform raw data into intelligible visual representations.
From spectral data to 3D models: visualizing the invisible 🔬
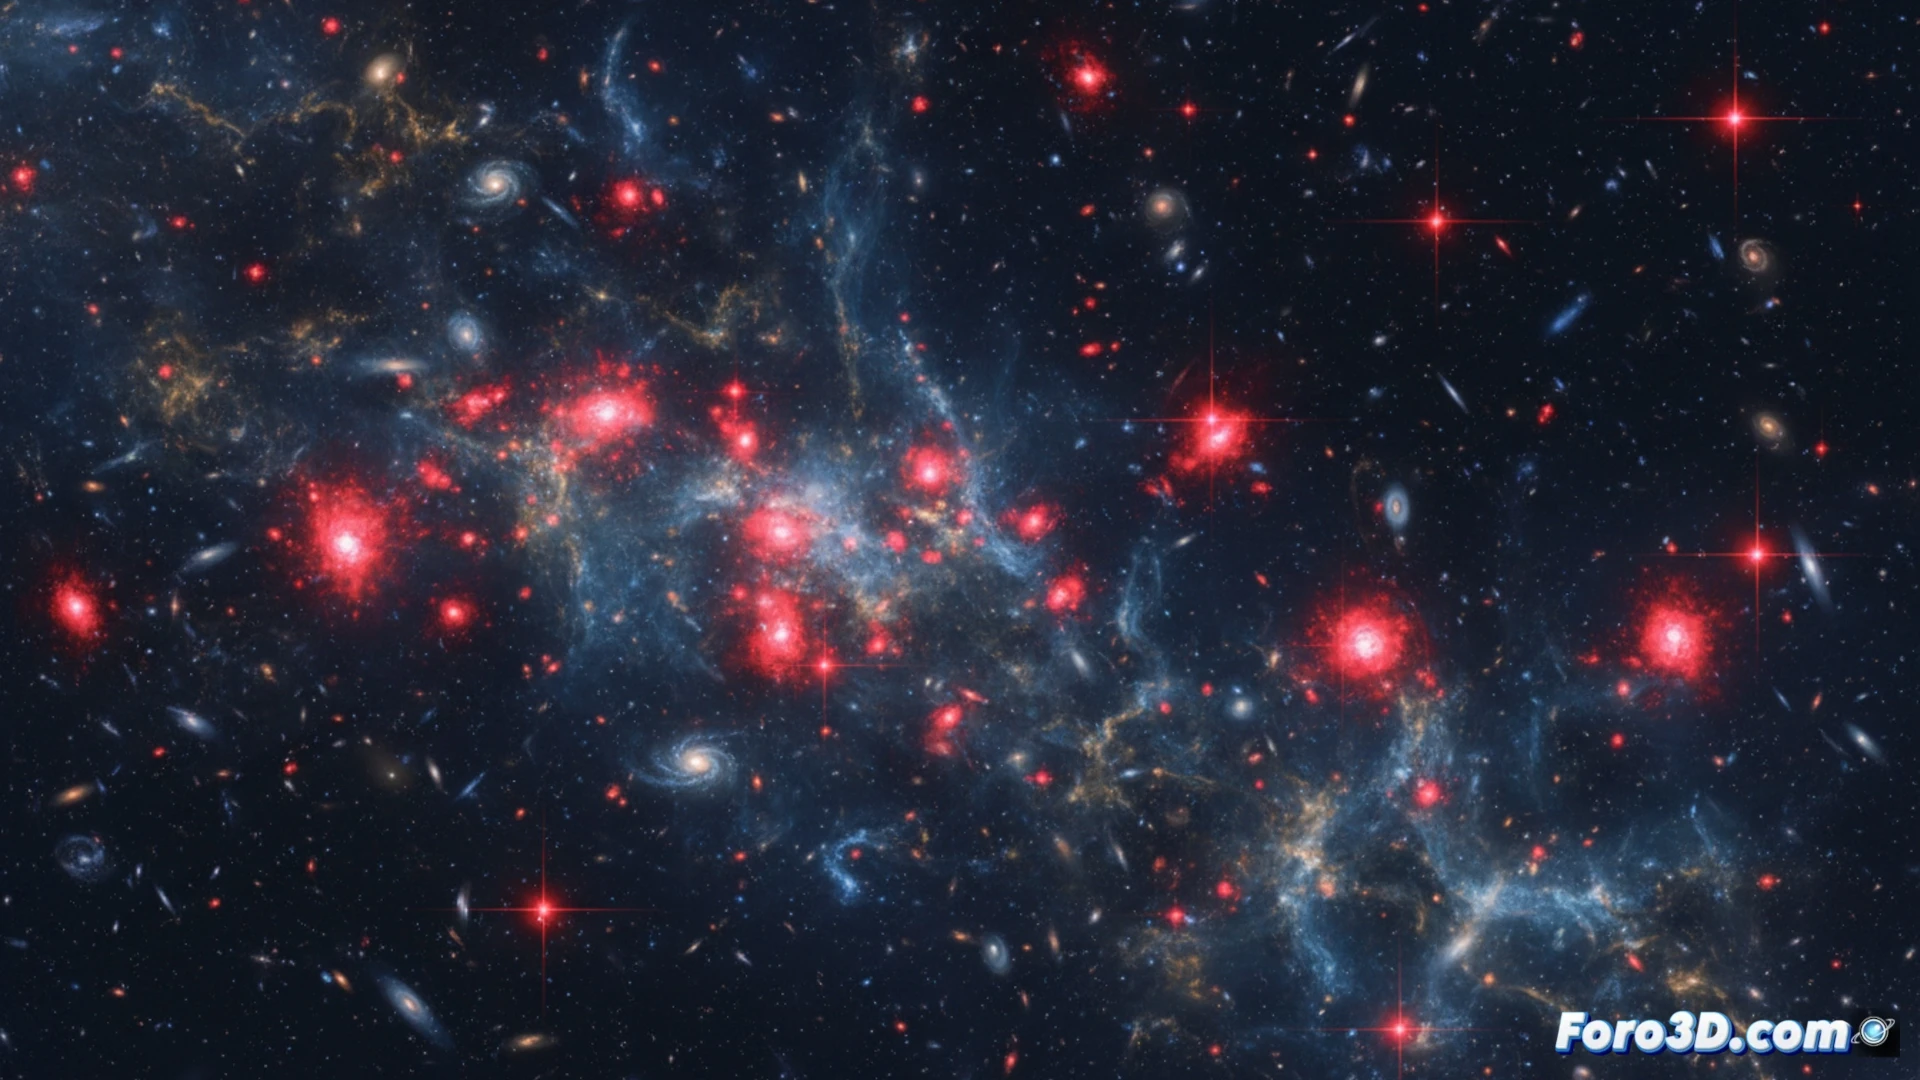
The red points are not a simple photograph. The James Webb captures spectra and images in infrared wavelengths. Scientific visualization is key here: astronomers process this data to assign visible colors, create brightness maps, and, most crucially, generate three-dimensional models of their distribution and properties. Specialized software tools allow rotating, slicing, and analyzing data volumes, searching for clues in their morphology and environment. This spatial representation helps discern whether they are compact or extended objects, and to correlate their position with other cosmic elements, supporting hypotheses about their origin and evolution.
Rendering the early universe for understanding 🎨
Beyond pure analysis, 3D visualization becomes an essential narrative tool. Renderings based on real data allow researchers to share and debate their interpretations intuitively. Creating a volumetric representation of these red points in their cosmic context not only aids research but also brings the public closer to the frontier of knowledge. Visualizing the unknown is the first step to understanding it, and in this challenge, foro3d techniques find an application of the highest scientific impact.
How are James Webb Telescope data processed and represented to identify and analyze the population of red objects in the early universe, and what technical challenges in scientific visualization does their interpretation present?
(P.S.: if your manta ray animation doesn't excite, you can always add music from a Channel 2 documentary)