The recent free trade agreement between the European Union and Australia is not just a political milestone; it is a reconfiguration of global logistics flows. The elimination of tariffs on goods such as wine, electric vehicles, or sheep meat redraws supply chains between both blocs. In this analysis, we explore how 3D modeling and visualization technologies can transform this complex data into interactive maps that reveal the real impact of the treaty on trade geopolitics. 🌐
3D Visualization of Flows and Tariff Quotas 📊
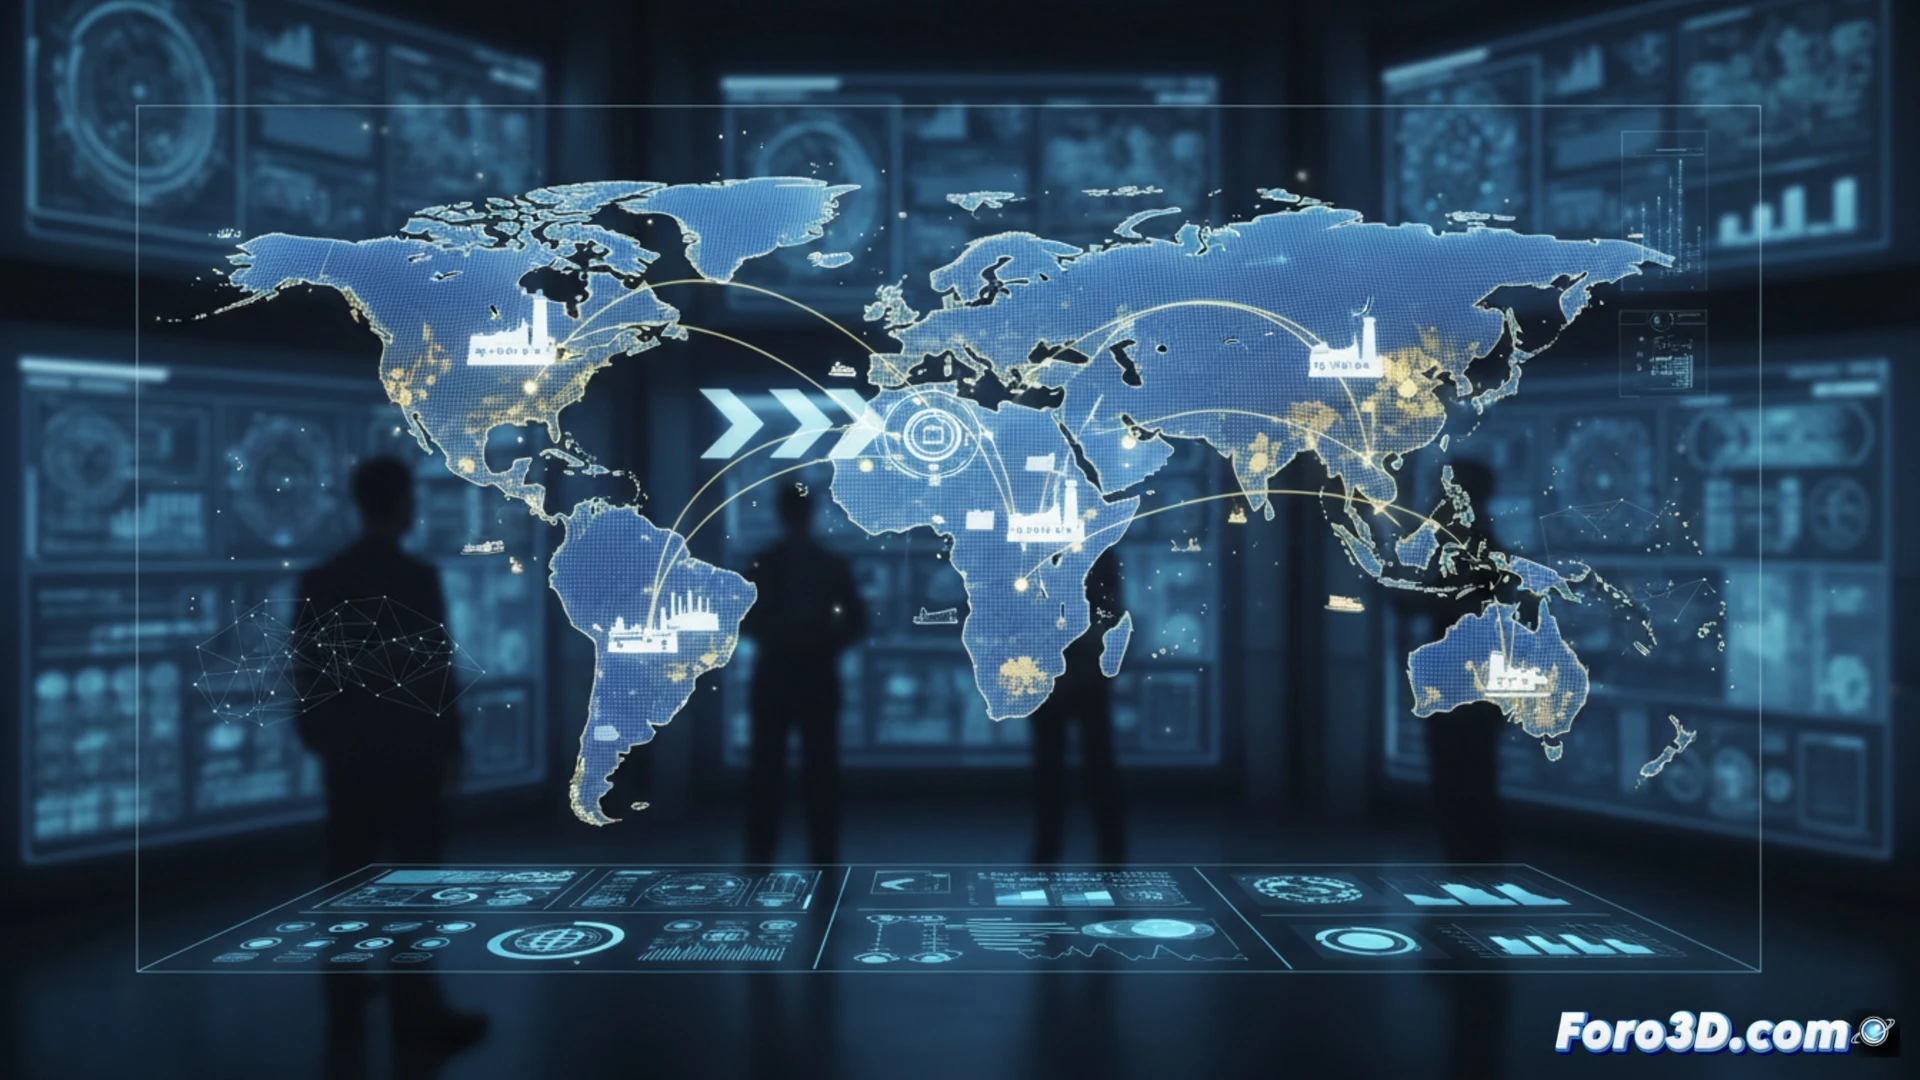
A 3D geospatial model allows overlaying layers of critical information. We can map historical maritime and air routes, and then simulate the projected increase in container volumes of European wine or cheeses to Australia, and Australian meat to Europe. The key tool is the visualization of tariff quotas for meat: a 3D model can show quotas filling in real time, representing volumes as blocks that grow up to a defined cap, making an abstract concept tangible. This helps logistics companies foresee bottlenecks.
Beyond Logistics: Geopolitics as a 3D System 🧩
Finally, the greatest value lies in modeling strategic dependence. A 3D system can connect this agreement with other treaties, showing Australia diversifying its trade amid tensions with China, and the EU securing raw materials. Visualizing these connections as a 3D nodal network turns geopolitical theory into an interactive landscape, where a change in one tariff resonates throughout the chain, offering a unique perspective for long-term strategic planning.
How can 3D modeling of critical infrastructures and logistics corridors visualize and optimize the new supply flows generated by the trade agreement between the EU and Australia?
(P.S.: simulating technological dependence is easy; the hard part is not depending on coffee while doing it)