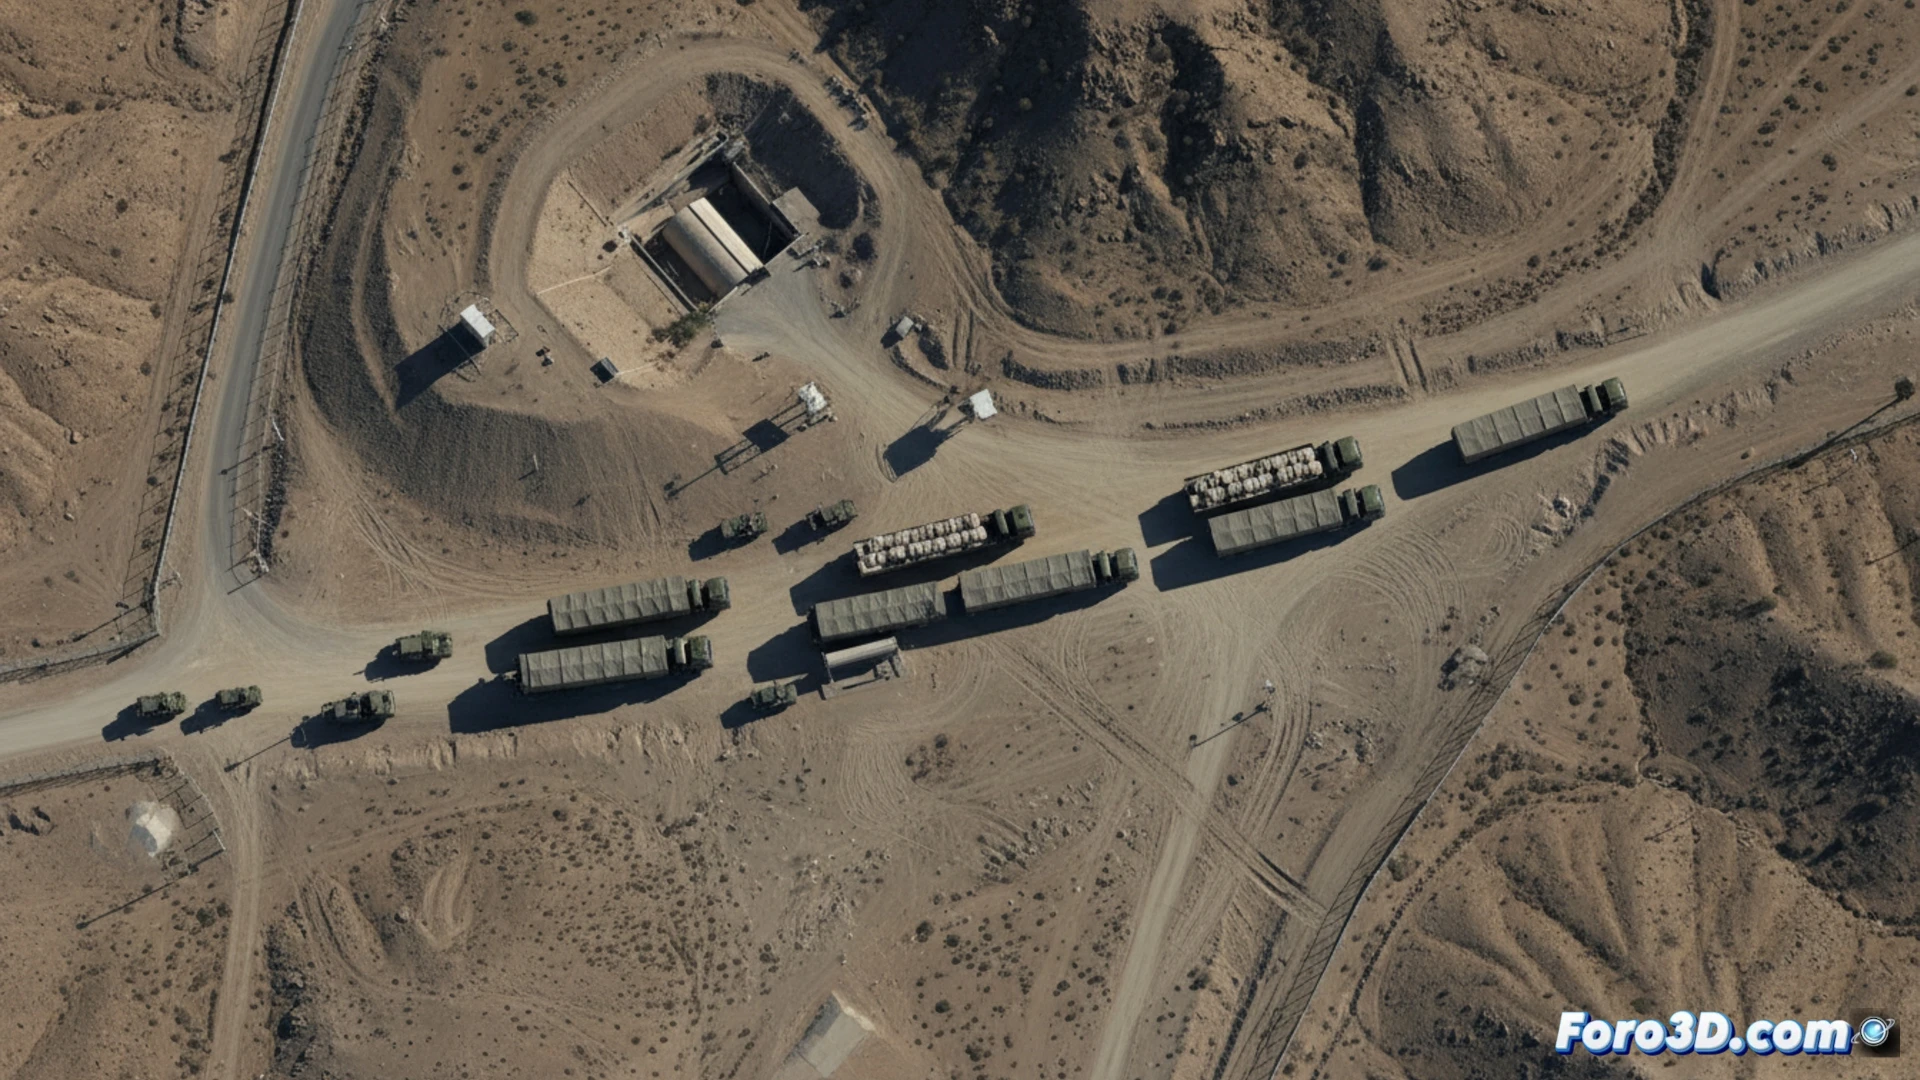
A satellite image has captured a mysterious convoy near the underground nuclear complex in Isfahan, Iran. Experts suggest it could be transporting enriched uranium, a critical material. This movement, out of reach of international inspectors, evidences the opacity in the Iranian nuclear supply chain. In a context of geopolitical tensions, the event underscores the urgency of monitoring these flows using new analysis tools. 🛰️
3D Modeling and Geospatial Simulation for Opaque Flows 🗺️
The news goes beyond the report to become a case study for geospatial visualization. An interactive 3D model of the Isfahan complex can be built, integrating topographic and infrastructure data. Over this, the hypothetical convoy logistics routes would be overlaid, cross-referencing road, tunnel, and checkpoint data. The simulation allows analyzing vulnerabilities, transit times, and possible detours, transforming a static image into a dynamic system for assessing risks in the supply chain of critical materials.
From Image to Interactive Geopolitical Awareness 🌍
This approach turns information into a powerful tool. An accessible 3D model enables analysts and the public to understand the scale and challenge of monitoring sensitive facilities. By simulating disruption or diversion scenarios, the consequences of failures in nuclear material containment are visualized. Thus, 3D technology not only illustrates but fosters geopolitical awareness based on concrete spatial analysis of global dependencies and risks.
How can satellite images and transportation data analysis reveal vulnerabilities and pressure points in critical supply chains, such as the nuclear one, altering the geopolitical balance?
(P.S.: visualizing the global supply chain is like following a trail of breadcrumbs... in 3D)