The recent elections in Denmark have left a deeply divided parliament, with twelve parties and a complicated search for majorities. This scenario, where data and negotiations are key, is perfect for applying 3D visualization tools. In our niche of Democracy and Digital Participation, we propose transforming these complex results into interactive models that allow any citizen to understand the situation at a glance, fostering more informed participation.
3D Modeling of the Folketing: seats and possible coalitions 🧩
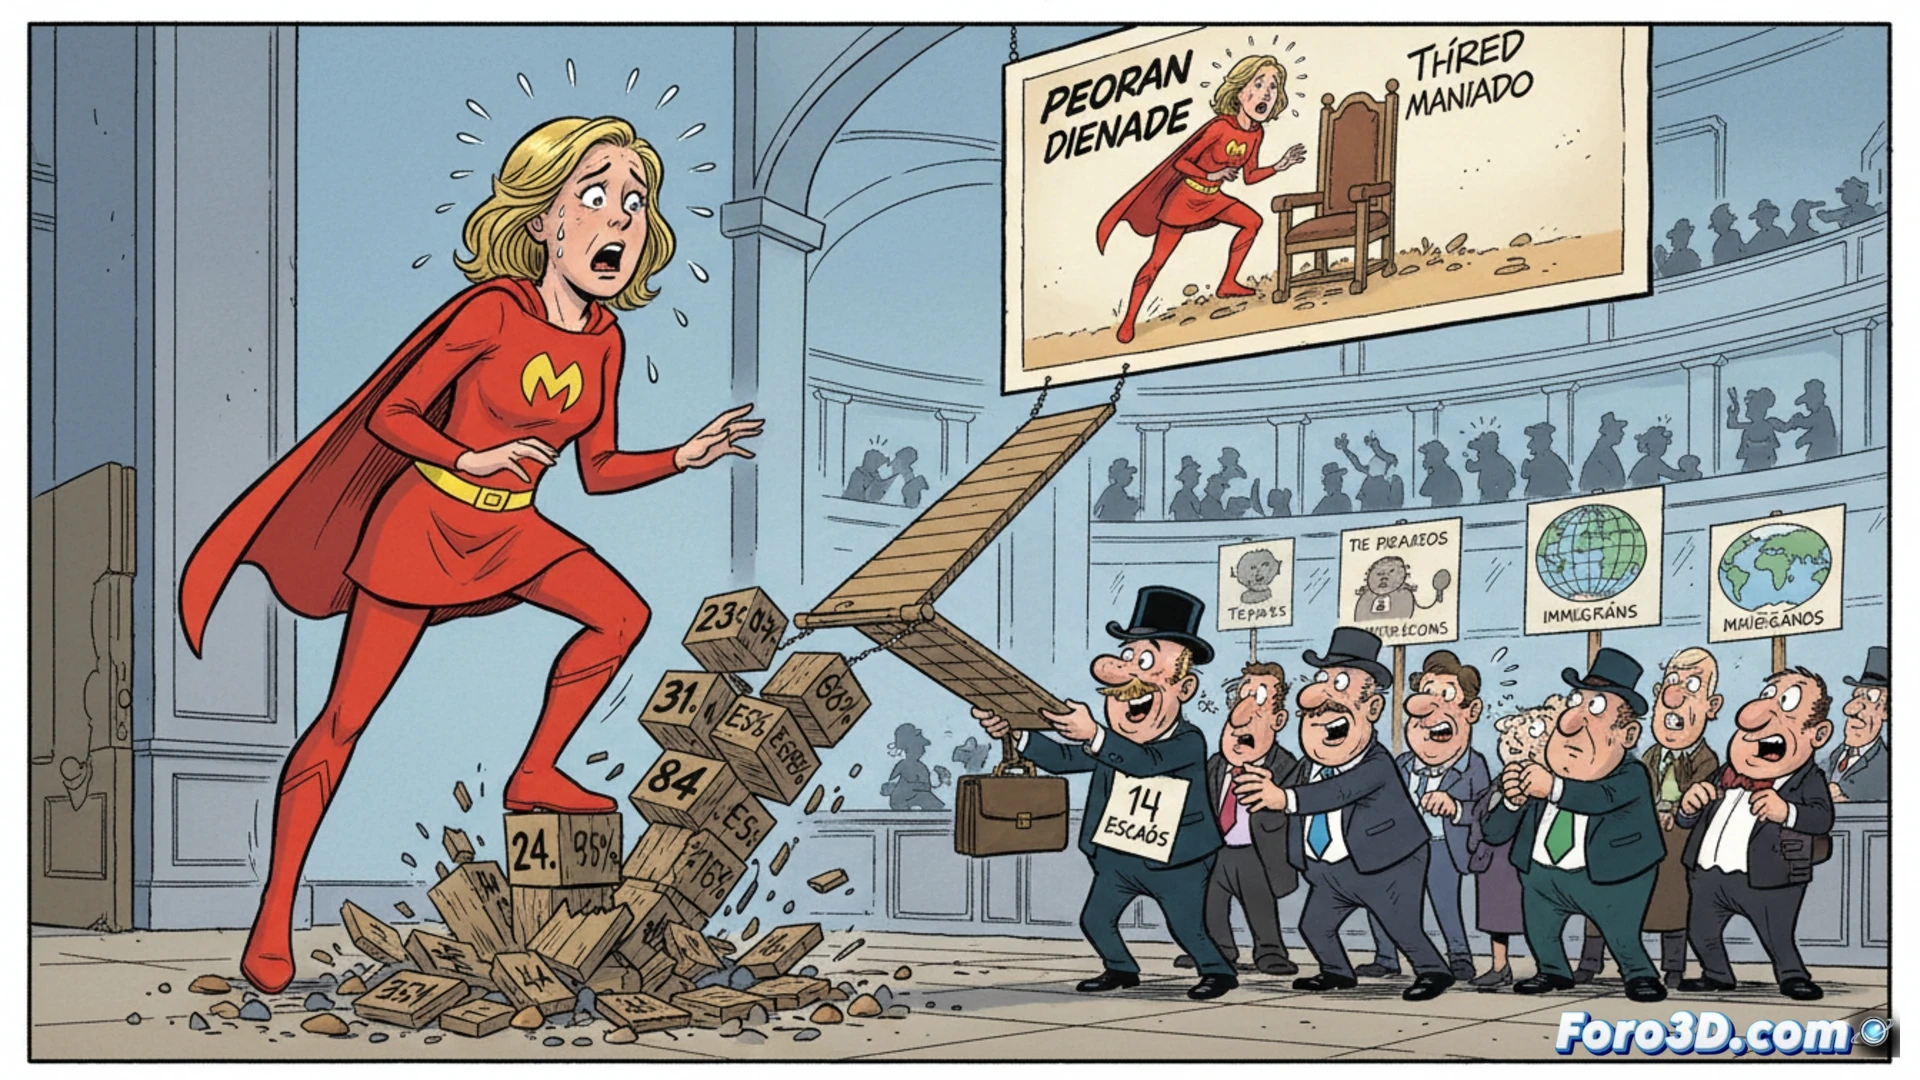
The first technical application would be a precise 3D model of the Danish hemicycle, the Folketing, with its 179 seats. Each seat would be represented as a colored block according to the party, creating an immediate visual map of each group's strength. The real power would lie in the interactivity: by clicking on the block of the Moderates, key with their 14 seats, the combinations of parties that, added to the Social Democrats, would reach the majority would automatically light up. We could animate the historical evolution, showing how the Social Democratic bench has shrunk to its lowest in a century, going from a solid block to a fragmented one. This temporal layer adds depth to the analysis.
From data to narrative: democratic outreach in the digital era 📖
Beyond static representation, these visualizations build a narrative. A citizen can manipulate the model, test hypothetical coalitions, and understand why negotiations are so arduous. This approach turns the coldness of percentages and seats into a spatial and comprehensible story. In a context of growing political fragmentation in Europe, these digital tools become essential to close the gap between institutional complexity and public understanding, thereby strengthening the pillars of deliberative democracy.
How could interactive 3D models and visualization of complex data help citizens understand and participate in government formation in fragmented parliamentary scenarios like the current one in Denmark?
(PS: 3D electoral panels are like promises: they look very nice but you have to see them in action)