The accusation that Hungary deliberately leaked confidential EU Council information to Russia has shaken the foundations of intra-community trust. This incident, denied by Budapest but considered serious by Brussels, transcends mere news: it is a perfect case study for visual political analysis. The complex web of loyalties, cross-communications, and conflicting narratives demands tools that go beyond text to be understood in its full dimension.
3D Network Mapping and Interactive Timelines 🗺️
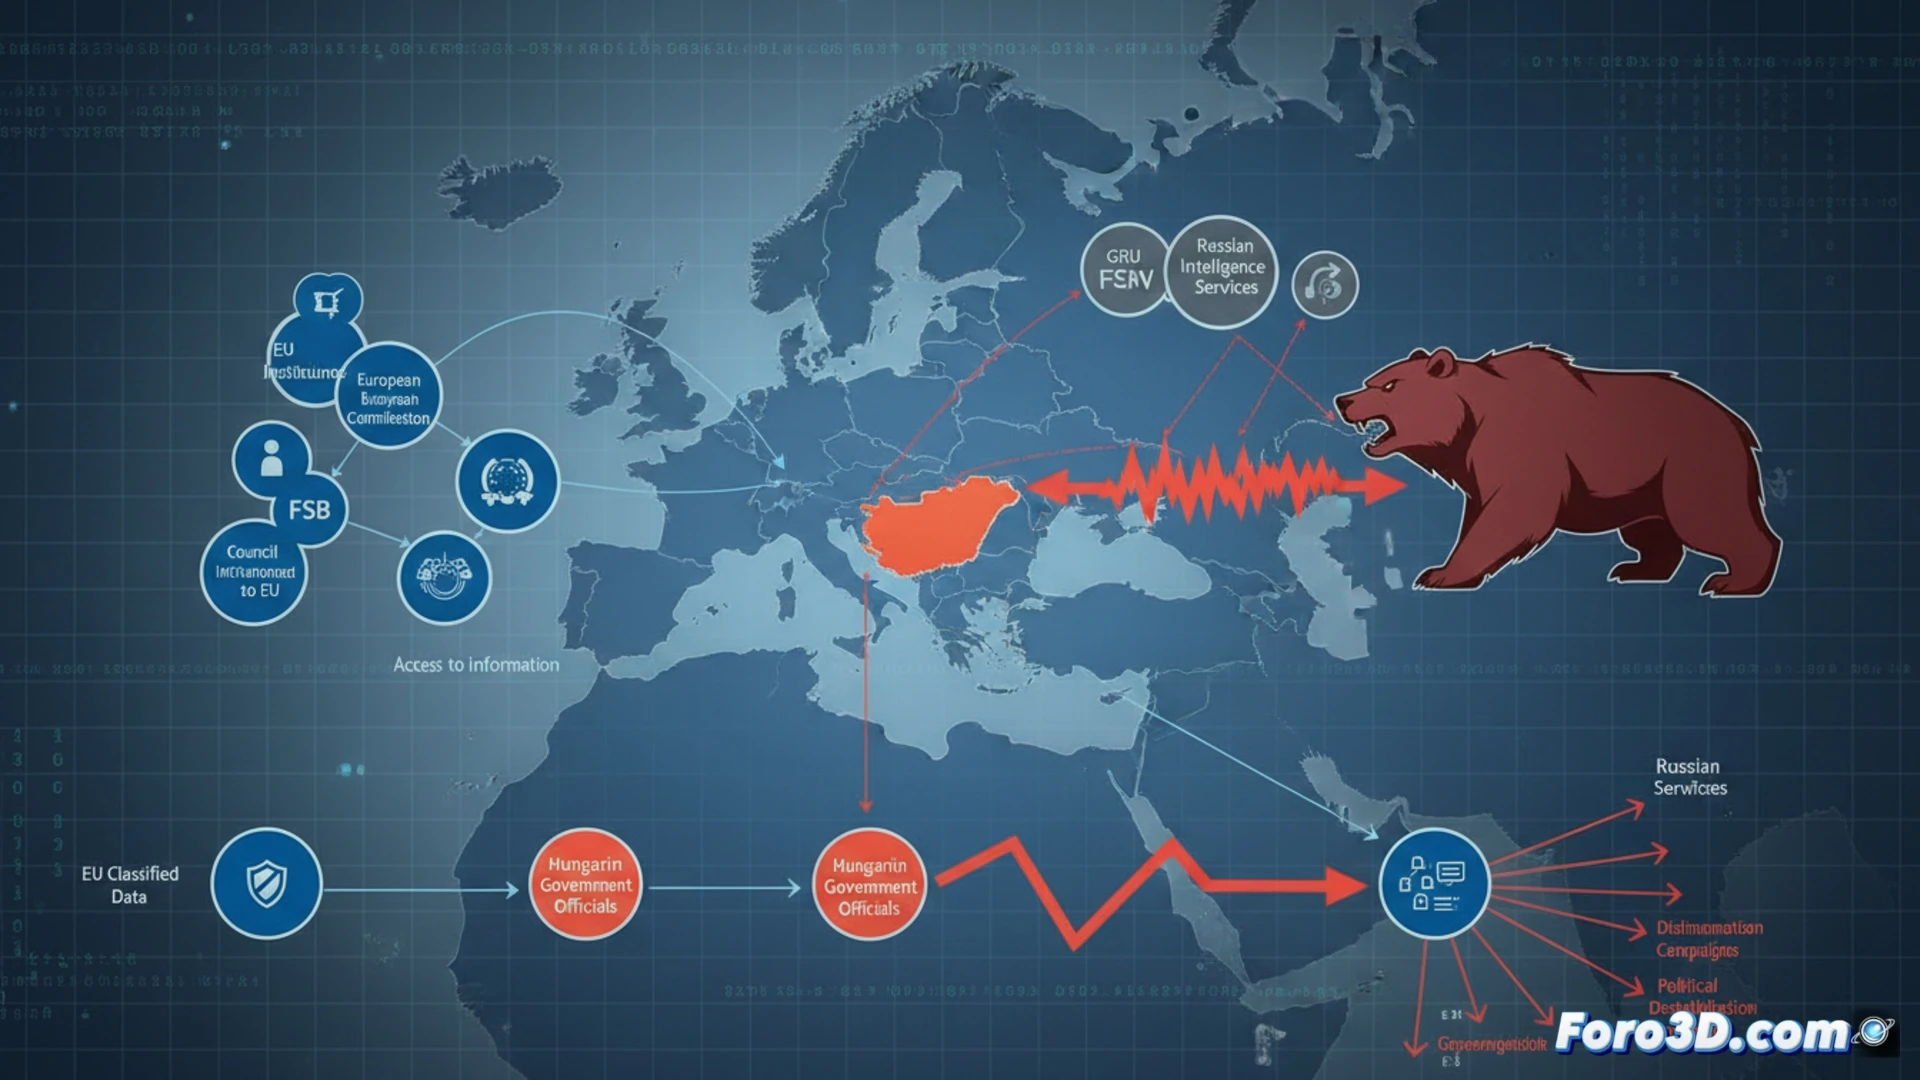
Data visualization technology allows unraveling this crisis. First, a 3D network model can map alliances and communication channels within the Council, highlighting atypical nodes and connections, such as the alleged direct Budapest-Moscow contacts during breaks. Second, an interactive timeline synchronizes events: the deliberation of sanctions, the exact moment of the alleged calls, and the sequence of public accusation and denial statements. This visualization contrasts official narratives and reveals key temporal discrepancies, transforming diplomatic opacity into a clear and analyzable flow of information.
Block Cohesion as a Dynamic Model 📊
The true value of visual analysis lies in projecting the impact. A dynamic model can simulate how this leak affects EU cohesion, represented as a geometric structure whose integrity is strained. Variables such as trust, foreign policy alignment, and diplomatic pressure can be visually quantified, showing fracture points and resilience. Thus, we move from anecdote to systemic understanding, using 3D to predict how a clandestine communication act redefines the political architecture of an entire bloc.
Can 3D technology help citizens better understand diplomatic conflicts?