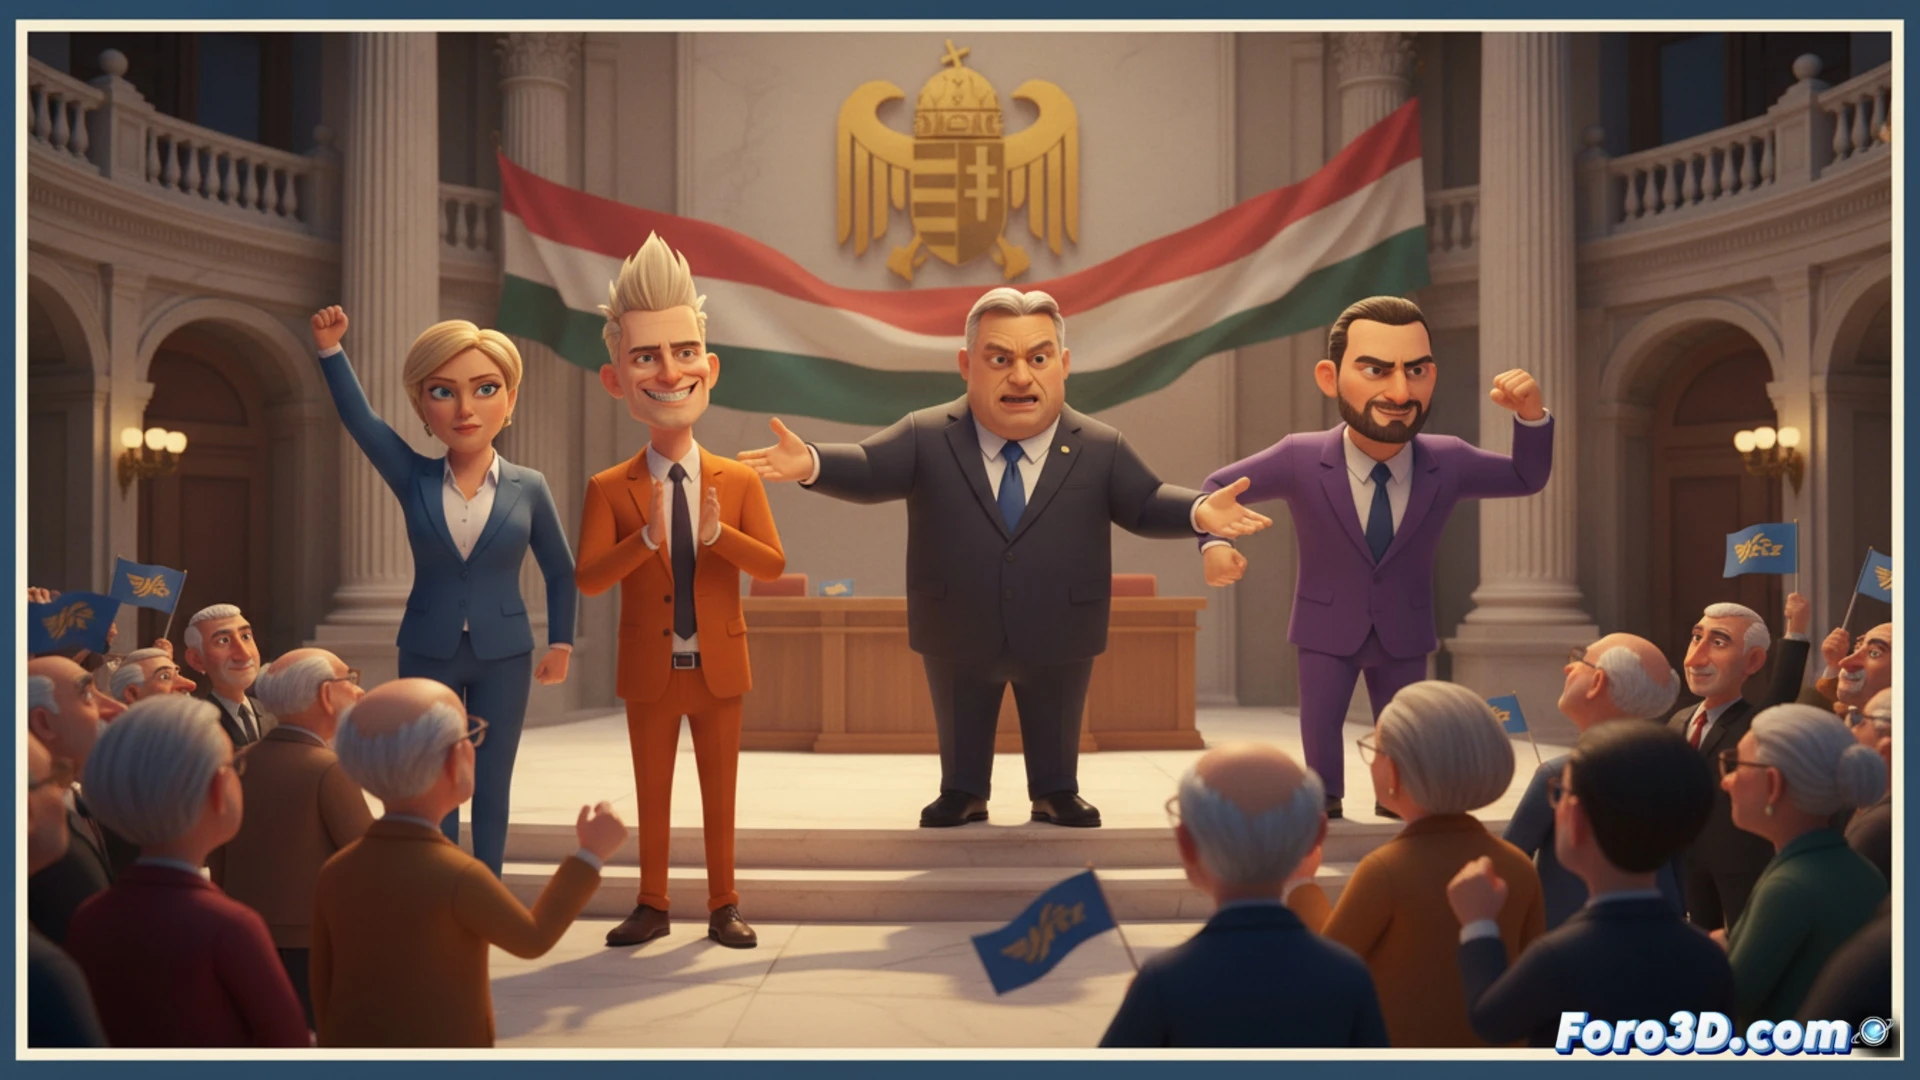
The recent event in Budapest with Orbán, Wilders, Le Pen, and Salvini is a perfect case study for political visual analysis. Beyond the headlines, reality showed a modest and aged audience, contrasting with the rhetoric of a pan-European patriotic wave. This gap between the projected message and tangible evidence is where visual analysis and 3D modeling tools demonstrate their value, allowing the staging to be dissected and the true impact of the event measured objectively and quantifiably.
Technical tools for objective deconstruction 🔬
Imagine applying a computer vision pipeline to the rally recordings. First, through 3D photogrammetry, we could reconstruct the scene to analyze the audience composition, density, and estimated demographics. Second, facial emotion analysis applied to the speakers could quantify the intensity and emotional tone of the speeches. Third, crowd analysis tools would evaluate the actual space occupancy versus capacity, visually evidencing the modest attendance. These technical data transform subjective impressions into verifiable metrics.
The narrative versus the visual metric 📊
The technical conclusion reinforces the political analysis: technology reveals that the event was optimized for media transmission, not for mass mobilization. An interactive 3D model would show how the scenography and camera angles created an image of strength for the media, while attendance data reveal a limited reach. This methodology exposes the essence of modern political communication, where perception, often shaped by visual resources, seeks to surpass factual reality.
How can 3D modeling and visual analysis be used to deconstruct the scenic architecture, spatial arrangement, and symbology of a political rally like the one in Budapest, and what does this reveal about the narrative of power and unity that is attempted to be projected?
(P.S.: deepfakes are like polygons: the closer you look, the more imperfections you find)